Most trading strategies look brilliant on a chart someone posted on X.
Very few survive twenty years of real data, trading costs, and a period they were never tuned on.
So I ran the experiment myself. Backtesting in Python, same dates, same costs, seven of the most popular rule-based strategies against the most boring one of all: buy and hold. First on the S&P 500, then on Microsoft, Apple, Amazon, Alphabet, Nvidia and Intel.
If you're:
building your first algorithmic trading project in Python,
Every trading tutorial shows you how to code an RSI or a moving average crossover.
Almost none of them show you what happens when you compare it fairly.
Here's the usual pattern. Someone picks one stock, one lucky period, tweaks the parameters until the curve looks great, ignores commissions, and publishes. The strategy "beats the market." On paper.
Then real money touches it and the edge disappears.
The problem isn't the indicator. It's the test.
So the question for this experiment was simple:
Did any of these strategies beat buy and hold without taking on more risk?
The Rules of the Experiment
Before writing a single line of code, I fixed the rules. No changes after seeing results.
Asset: SPY (the S&P 500 ETF), adjusted for dividends and splits.
Period: January 2007 to September 2026. That includes the 2008 crash, the 2020 COVID drop, and the 2022 bear market.
Timeframe: monthly bars. Signals are checked once per month, at the close, and executed on the next bar. No look-ahead.
Costs: 0.1% per trade, every time the position changes.
Cash: when a strategy is out of the market, it earns 0%. That's conservative, and I'll come back to it.
Holdout: 2007 to 2019 is the in-sample period. 2020 to 2026 is the holdout, a period I treat as unseen. All parameters are textbook defaults. Nothing was optimized.
Why monthly? Because most people who search "how to backtest a trading strategy" aren't day traders. They have a job. A rule you check once a month is a rule you can actually follow.
The 7 Strategies
Each one is a classic you'll find in any trading book. Here's what each rule says, in plain English.
1. Moving average crossover (3/10). Long when the 3-month average is above the 10-month average. Roughly the monthly version of the famous 50/200-day golden cross.
2. RSI regime (14). Long when the 14-period RSI is above 50. Out when momentum fades below 50.
3. MACD (12/26/9). Long when the MACD line is above its signal line.
4. Bollinger Bands reversion (20, 2). Buy when price closes below the lower band. Sell when it recovers to the middle band. The classic "buy the dip" rule.
5. 12-month breakout. Buy when price closes at a new 12-month high. Exit when it closes below the lowest close of the previous 6 months.
6. 12-month momentum. Long if SPY is up over the last 12 months. Otherwise, cash.
7. 10-month trend filter. Long when price is above its 10-month moving average. This is the monthly equivalent of the 200-day moving average filter.
And the benchmark: buy and hold. Buy once in 2007. Never touch it again.
Getting the Data: Why the Source Matters
A backtest is only as good as its prices.
If your data doesn't adjust for dividends, buy and hold looks worse than it really is (SPY pays roughly 1.5% a year). If splits aren't handled, your signals fire on fake crashes. I've written before about why free historical data sources keep breaking, and it's the first thing that ruins a backtest.
For this test I used the EODHD end-of-day API. One request gives you decades of monthly, weekly or daily bars with an adjusted_close field already calculated. If you've never used it, my end-of-day stock data guide in Python walks through the setup.
Use the same data I used
Dividend-adjusted prices for 150,000+ tickers, 30+ years of history. Get 10% off with code KEVIN10.
→ Try EODHD here
The Python Backtesting Code
No backtesting library. Just pandas and numpy, so you can see every assumption.
If you want a slower, step-by-step introduction first, start with how to backtest a trading strategy with Python and EODHD. This script goes further: seven strategies, seven tickers, one engine. To test your own list, just edit TICKERS.
pip install pandas numpy requests matplotlib
import requests
import numpy as np
import pandas as pd

API_KEY = "YOUR_EODHD_API_KEY"
COST = 0.001  # 0.1% per position change


def load_prices(ticker="SPY.US", start="2005-01-01", end="2026-09-30"):
    url = f"https://eodhd.com/api/eod/{ticker}"
    params = {"api_token": API_KEY, "period": "m", "fmt": "json",
              "from": start, "to": end}
    r = requests.get(url, params=params, timeout=30)
    r.raise_for_status()
    df = pd.DataFrame(r.json())
    df.index = pd.to_datetime(df["date"]) + pd.offsets.MonthEnd(0)
    return df["adjusted_close"].astype(float)


def rsi(s, n=14):
    d = s.diff()
    up = d.clip(lower=0).ewm(alpha=1 / n, adjust=False).mean()
    dn = (-d.clip(upper=0)).ewm(alpha=1 / n, adjust=False).mean()
    return 100 - 100 / (1 + up / dn)


def stateful(entry, exit_):
    # Holds a position from an entry signal until an exit signal
    pos, out = 0, []
    for e, x in zip(entry, exit_):
        if pos == 0 and e:
            pos = 1
        elif pos == 1 and x:
            pos = 0
        out.append(pos)
    return pd.Series(out, index=entry.index)


def signals(c):
    s = {"Buy & Hold": pd.Series(1, index=c.index)}
    s["SMA Crossover (3/10)"] = (c.rolling(3).mean() > c.rolling(10).mean()).astype(int)
    s["RSI(14) > 50"] = (rsi(c) > 50).astype(int)
    macd = c.ewm(span=12, adjust=False).mean() - c.ewm(span=26, adjust=False).mean()
    s["MACD (12/26/9)"] = (macd > macd.ewm(span=9, adjust=False).mean()).astype(int)
    mid, sd = c.rolling(20).mean(), c.rolling(20).std()
    s["Bollinger Reversion (20,2)"] = stateful(c < mid - 2 * sd, c > mid)
    s["12-Month Breakout"] = stateful(c >= c.rolling(12).max(),
                                      c < c.shift(1).rolling(6).min())
    s["12-Month Momentum"] = (c.pct_change(12) > 0).astype(int)
    s["10-Month Trend Filter"] = (c > c.rolling(10).mean()).astype(int)
    return s


def backtest(c, sig, start, end):
    ret = c.pct_change()
    pos = sig.shift(1).fillna(0)  # trade on the NEXT bar
    pos, ret = pos[start:end], ret[start:end]
    trades = pos.diff().abs().fillna(pos.iloc[0])
    strat = pos * ret - trades * COST
    equity = (1 + strat).cumprod()
    years = len(strat) / 12
    vol = strat.std() * np.sqrt(12)
    return {
        "CAGR %": (equity.iloc[-1] ** (1 / years) - 1) * 100,
        "Max DD %": (equity / equity.cummax() - 1).min() * 100,
        "Sharpe": strat.mean() * 12 / vol if vol > 0 else 0.0,  # a rule that never trades has zero volatility
        "Trades": int(trades.sum()),
        "Exposure %": pos.mean() * 100,
    }


TICKERS = ["SPY.US", "MSFT.US", "AAPL.US", "AMZN.US", "GOOGL.US", "NVDA.US", "INTC.US"]
periods = {"Full": ("2007-01", "2026-09"),
           "In-sample": ("2007-01", "2019-12"),
           "Holdout": ("2020-01", "2026-09")}

rows = []
for ticker in TICKERS:
    close = load_prices(ticker)
    for strat_name, sig in signals(close).items():
        for period, (a, b) in periods.items():
            rows.append({"Ticker": ticker, "Strategy": strat_name, "Period": period,
                         **backtest(close, sig, a, b)})

results = pd.DataFrame(rows)
results.to_csv("backtest_results.csv", index=False)

for (ticker, period), table in results.groupby(["Ticker", "Period"], sort=False):
    print(f"\n=== {ticker} | {period} ===")
    print(table.set_index("Strategy").drop(columns=["Ticker", "Period"]).round(2).to_string())
Two lines in that script matter more than all the indicators combined.
sig.shift(1) means every decision uses only information available at the time. Remove it and you're trading with tomorrow's newspaper.
trades * COST means every switch costs money. Remove it and the strategies that trade the most look the best.
That's where most backtests lie.
The Results: 20 Years of Backtesting
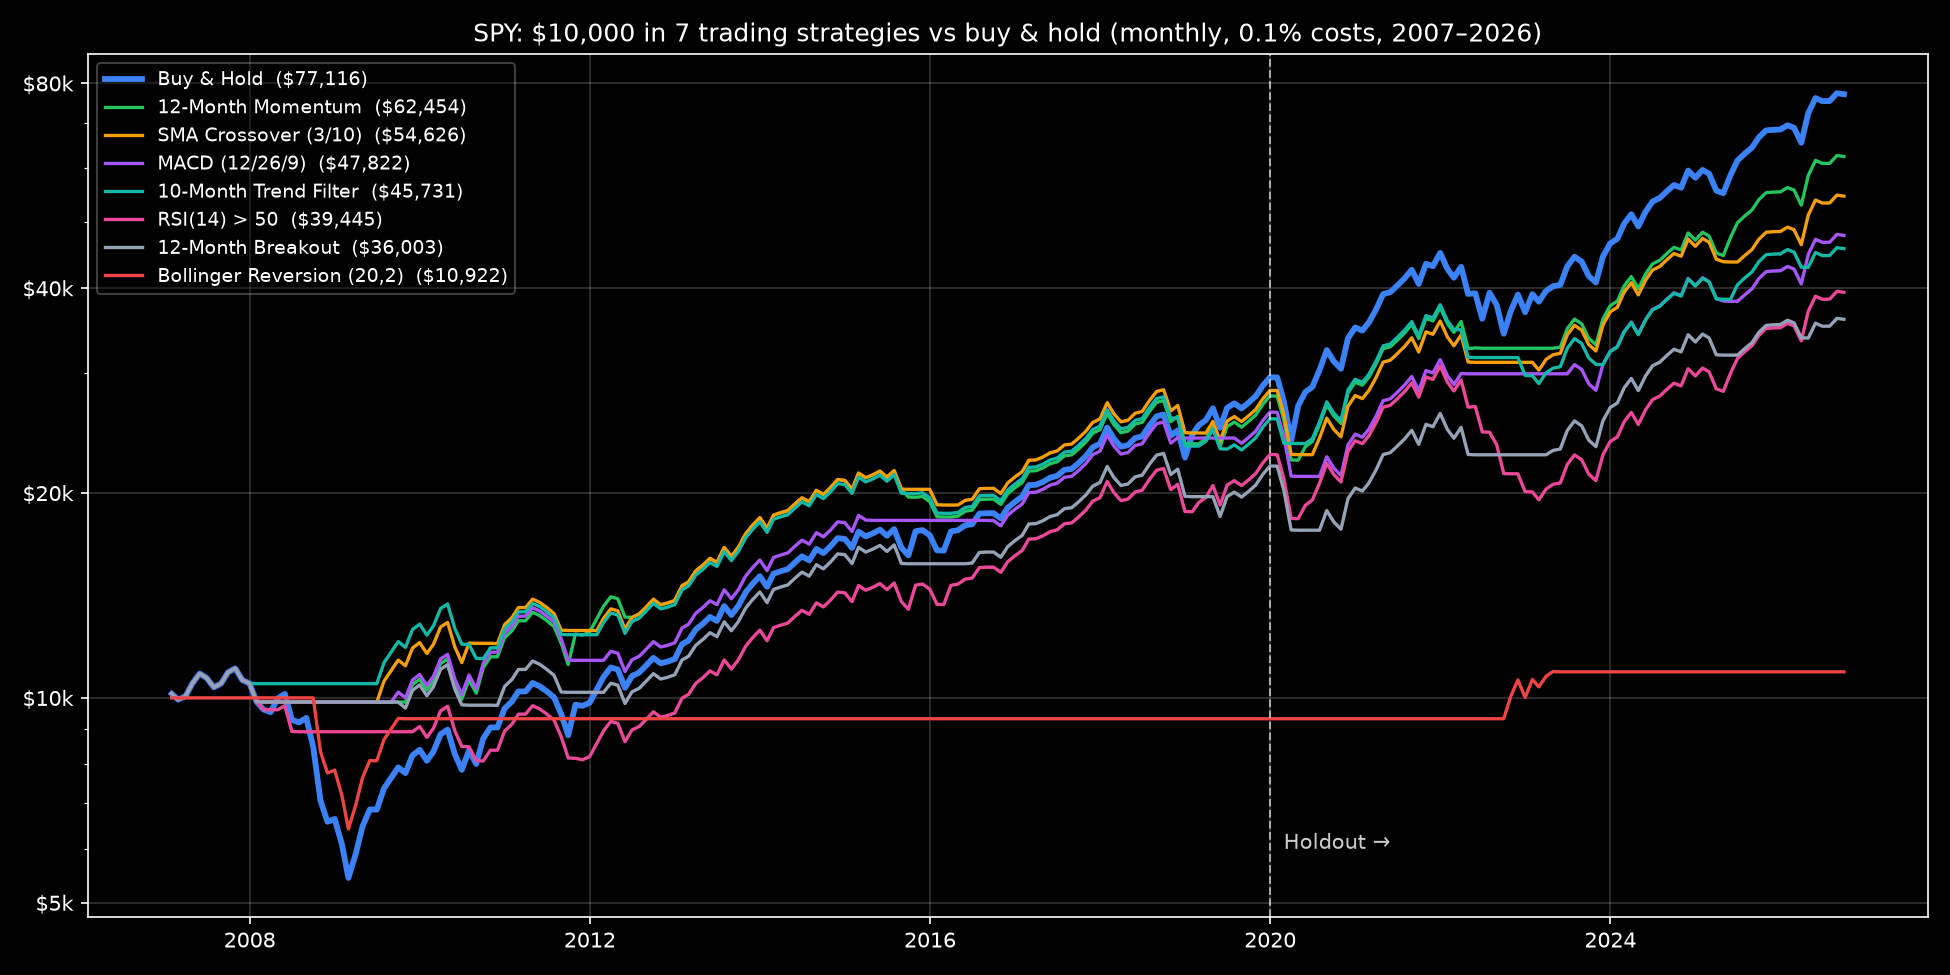
Here's the full period, January 2007 to September 2026. $10,000 starting capital.
Strategy
CAGR
Max Drawdown
Sharpe
Trades
Time in Market
Final Value
Buy & Hold
10.90%
-50.8%
0.75
1
100%
$77,116
12-Month Momentum
9.72%
-19.5%
0.83
15
84%
$62,454
SMA Crossover (3/10)
8.98%
-19.7%
0.80
19
79%
$54,626
MACD (12/26/9)
8.25%
-19.5%
0.79
15
70%
$47,822
10-Month Trend Filter
8.00%
-23.4%
0.77
33
79%
$45,731
RSI(14) > 50
7.20%
-36.4%
0.62
21
88%
$39,445
12-Month Breakout
6.70%
-22.9%
0.65
19
74%
$36,003
Bollinger Reversion (20,2)
0.45%
-35.8%
0.10
4
8%
$10,922
Trades = number of position changes (entries plus exits). Sharpe calculated without a risk-free rate.
The short answer to the original question:
No strategy beat buy and hold on total return.
Not one.
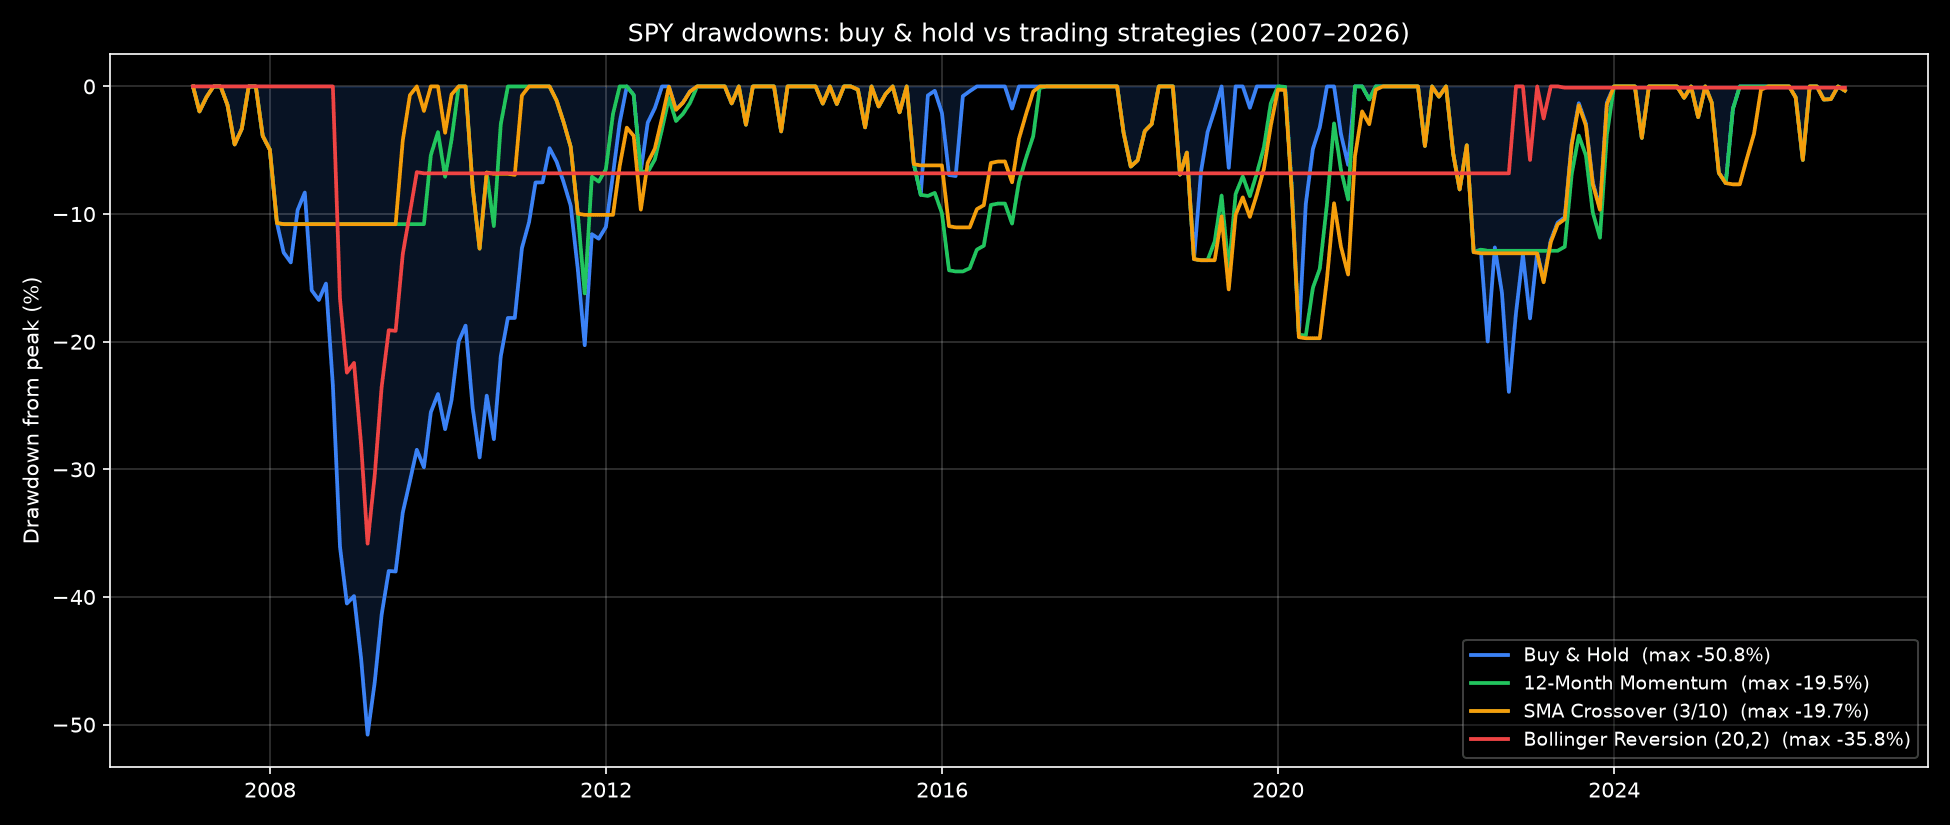
But that's only half the story. Look at the drawdown column.
Buy and hold lost more than half its value between 2007 and 2009. Four strategies (momentum, SMA crossover, MACD and the trend filter) never fell more than about 23%. And all four had a better Sharpe ratio than buy and hold over the full period.
So you could argue they won on risk-adjusted terms.
Then I checked the holdout.
The Holdout Period Changed Everything
The in-sample years (2007 to 2019) were kind to trend-following. The 2008 crash was long and slow, exactly the kind of decline a monthly trend rule is built to sidestep.
Strategy
CAGR 2007–2019
Sharpe 2007–2019
CAGR 2020–2026
Sharpe 2020–2026
Buy & Hold
8.70%
0.65
15.23%
0.93
12-Month Momentum
8.18%
0.77
12.74%
0.92
SMA Crossover (3/10)
8.33%
0.84
10.22%
0.77
MACD (12/26/9)
7.72%
0.84
9.25%
0.75
10-Month Trend Filter
7.54%
0.79
8.89%
0.76
In the period the strategies had never "seen," buy and hold won on returns and on Sharpe ratio. Momentum came closest, practically tied on risk-adjusted terms, but still about 2.5 points a year behind.
Why? Because 2020 was the opposite of 2008.
The COVID crash took about a month. The recovery took a few more. A monthly trend rule sells after the damage is done and buys back after the rebound has already started. You pay for the insurance and the insurance doesn't pay out.
The equity curve shows it clearly. The momentum strategy was ahead of buy and hold at the end of every year from 2008 to 2018. Eleven years in front.
Then buy and hold passed it in 2019 and never looked back.
Eleven good years can still end in second place.
Does It Hold Up on Popular Stocks?
SPY is one asset. One asset proves nothing.
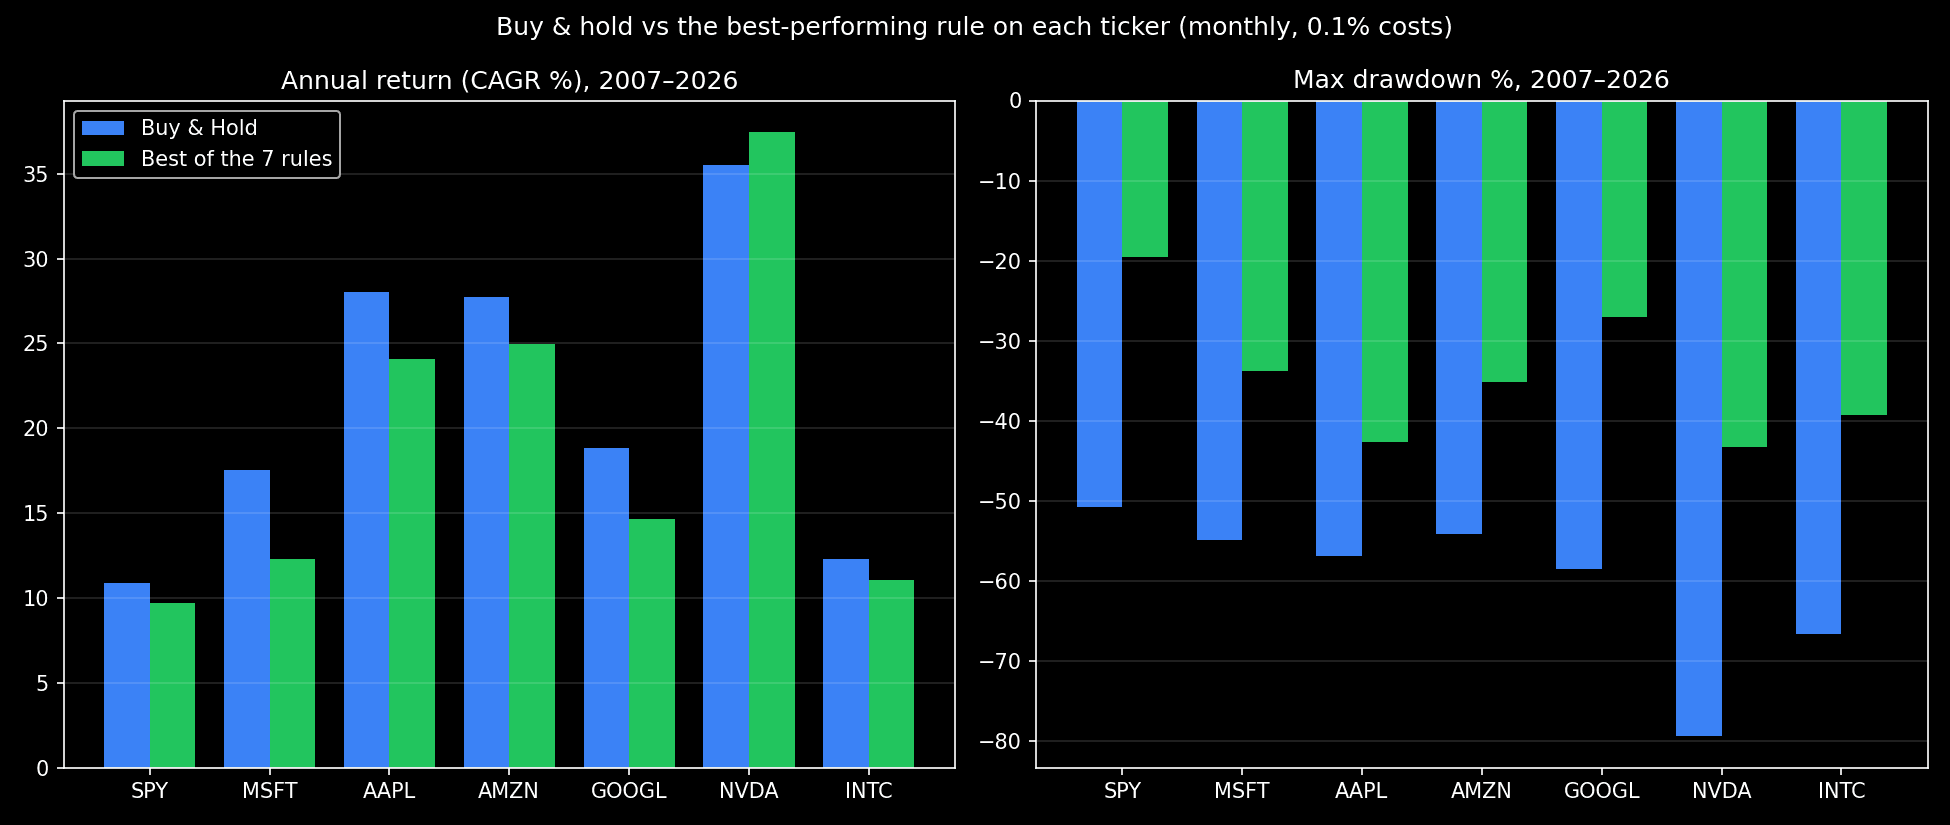
So I ran the exact same script, with zero parameter changes, on six of the most popular stocks of the last two decades: Microsoft, Apple, Amazon, Alphabet, Nvidia and Intel. That's 42 more strategy and stock combinations.
Full period, January 2007 to September 2026. For each ticker, buy and hold against the rule with the highest return:
Ticker
Buy & Hold CAGR
Buy & Hold Max DD
Best Rule
Best Rule CAGR
Best Rule Max DD
SPY
10.9%
-51%
12-Month Momentum
9.7%
-20%
MSFT
17.6%
-55%
10-Month Trend Filter
12.3%
-34%
AAPL
28.0%
-57%
RSI(14) > 50
24.1%
-43%
AMZN
27.8%
-54%
12-Month Momentum
25.0%
-35%
GOOGL
18.8%
-59%
10-Month Trend Filter
14.6%
-27%
NVDA
35.5%
-79%
10-Month Trend Filter
37.4%
-43%
INTC
12.3%
-67%
SMA Crossover (3/10)
11.1%
-39%
Three things jumped out.
1. Buy and hold won almost everywhere. Out of 42 stock and strategy combinations, exactly one beat it on return: Nvidia with the 10-month trend filter. 37.4% a year against 35.5%, while cutting the worst drawdown from -79% to -43%.
2. The risk-adjusted edge mostly disappeared. On SPY, four rules had a better Sharpe ratio than buy and hold. On the six stocks, only one of 42 did (that same Nvidia combination). Single stocks are noisier than an index. More false signals, more whipsaws, more costs.
3. Intel was the exception in the holdout. From 2020 to 2026, the only stock where any rule beat buy and hold on return was Intel. Five of the seven rules did it. The SMA crossover made 20.6% a year against 13.0% for buy and hold.
Intel is the stock that broke. It lost two thirds of its value at the worst point of this period. Trend rules got you out.
That's the real lesson hiding in this table.
In 2007, nobody knew Nvidia would rise almost 500x or that Intel would stumble for years. If you hold the next Nvidia, timing rules cost you money. If you hold the next Intel, they save you. You just don't know which one you own until it's too late.
Strategy by Strategy: What I Learned
12-Month Momentum: the most honest performer
Pros
Best Sharpe ratio over the full period (0.83 vs 0.75).
Cut the maximum drawdown from -51% to -20%.
Only 15 trades in almost 20 years. Cheap and easy to follow.
Both behaved almost like momentum. Lower drawdowns, slightly lower returns, Sharpe ratios around 0.80.
They're three ways of asking the same question: is the trend up?
That's worth knowing before you spend a weekend comparing indicators that measure the same thing.
10-Month Trend Filter: death by whipsaw
The famous "stay above the 200-day average" rule made 33 trades, the most of any strategy. Every time SPY hovered around its average, it flipped in and out.
Each flip cost 0.1% plus the move it missed.
RSI > 50: worse drawdown in the holdout than the market
This one surprised me. In the 2020–2026 period, the RSI rule's maximum drawdown was -36.4%, deeper than buy and hold's -23.9%. It sold near bottoms and bought back near tops.
Best for: nothing, at least on monthly SPY bars.
12-Month Breakout: late to the party
Waiting for a new 12-month high means you always buy after a big move. Exiting on a 6-month low means you always sell after a big drop. It captured the middle of trends and paid for both edges.
Bollinger Reversion: the worst idea on an index
Buying when price falls below the lower band sounds like "buy low." In 2008 it meant buying a falling market and holding it down another 35%.
It was in the market only 8% of the time and turned $10,000 into $10,922 after almost 20 years.
The lesson: mean reversion and trend-following are opposite bets. On a broad index over monthly bars, the trend won.
What This Backtest Does NOT Prove
A good backtest tells you its own limits. Here are mine.
Cash earned 0%. In reality, money out of the market could sit in T-bills. With timing strategies spending 15% to 30% of the time in cash, that would close part of the gap. It wouldn't flip the conclusion in the holdout, but it matters.
Survivorship bias. I picked the six stocks in 2026, knowing how their stories ended. That flatters buy and hold. A random list of 2007 stocks would include companies that no longer exist.
No crypto or commodities. These rules may behave very differently there.
Monthly bars. Daily signals react faster to crashes but trade much more. That's a different experiment.
No taxes. Every sale in a taxable account creates a tax event. Buy and hold defers all of it, a hidden advantage this table doesn't show.
Start date matters. Starting in early 2007, right before a crash, flatters timing strategies. I tested how much a start date can distort results in this $10,000 experiment with Claude.
And if you plan to measure your own results, make sure you calculate returns correctly. CAGR, total return and average return tell three different stories.
Key Takeaways
Only 1 of 49 tests beat buy and hold on total return over 20 years, across SPY and six popular stocks, after costs.
Trend-following rules bought crash insurance. They cut drawdowns by more than half and paid roughly 1 to 3 points of annual return for it.
The holdout is where strategies die. What worked from 2007 to 2019 fell behind from 2020 to 2026.
Final Thoughts
Technical analysis didn't fail here. It did exactly what it promises: it reduced risk.
It just didn't make you richer.
If you can genuinely hold through a 50% drawdown, buy and hold is very hard to beat. If you can't, a simple momentum rule might be the price worth paying to stay invested.
Either way, the only way to know is backtesting in Python with honest rules, real costs and a period you didn't tune on. The code above gives you all three.
Run this backtest on any ticker
Swap SPY.US for any stock, ETF or index. Adjusted prices included. 10% off with code KEVIN10.
→ Get your EODHD API key
More experiments like this one
Python, financial data APIs and AI tools, tested with real numbers.
→ Visit kevinmeneses.com
FAQs
❓ What is backtesting in Python?
✅ Backtesting in Python means running a trading rule on historical prices to see how it would have performed. You load price data with pandas, generate buy and sell signals, shift them one bar to avoid look-ahead bias, and calculate returns after costs. It doesn't predict the future, but it filters out ideas that never worked.
❓ How do you backtest a trading strategy?
✅ Define the rules before looking at results, get dividend-adjusted prices, apply the signals with a one-bar delay, subtract trading costs, and compare against buy and hold. Then test on a holdout period you didn't use to build the strategy. If it only works in-sample, it doesn't work.
❓ Does technical analysis actually work?
✅ In this test, trend-following indicators like momentum, moving averages and MACD reduced maximum drawdown from about -51% to about -20%. None of them beat buy and hold on total return after costs. So it worked as risk management, not as a way to outperform the S&P 500.
❓ Is buy and hold better than trading?
✅ On SPY from 2007 to 2026, buy and hold had the highest return (10.9% a year) of all eight approaches tested, and it also won on Microsoft, Apple, Amazon, Alphabet and Intel. Trading rules lowered risk but also lowered returns. Buy and hold also pays fewer commissions and defers taxes, which this backtest doesn't even count.
❓ Do trading strategies work better on individual stocks?
✅ Not in this test. Across Microsoft, Apple, Amazon, Alphabet, Nvidia and Intel, only one of 42 strategy and stock combinations beat buy and hold on return over 20 years. The rules did cut drawdowns, and they helped most on the stock that collapsed (Intel), which is exactly the case you can't predict in advance.
❓ What is the best Python backtesting library?
✅ Backtesting.py, Backtrader and vectorbt are the most popular. For a first project, plain pandas like the code above is often better because every assumption is visible. Once you understand the mechanics, a library saves time on portfolio logic and reporting.
❓ Which trading strategy had the best backtest results?
✅ The 12-month momentum rule had the best risk-adjusted result: a 0.83 Sharpe ratio, a -19.5% maximum drawdown and only 15 trades in nearly 20 years. It still finished with $62,454 versus $77,116 for buy and hold on a $10,000 start.
This article is for educational purposes only and is not financial advice. Past performance doesn't guarantee future results.