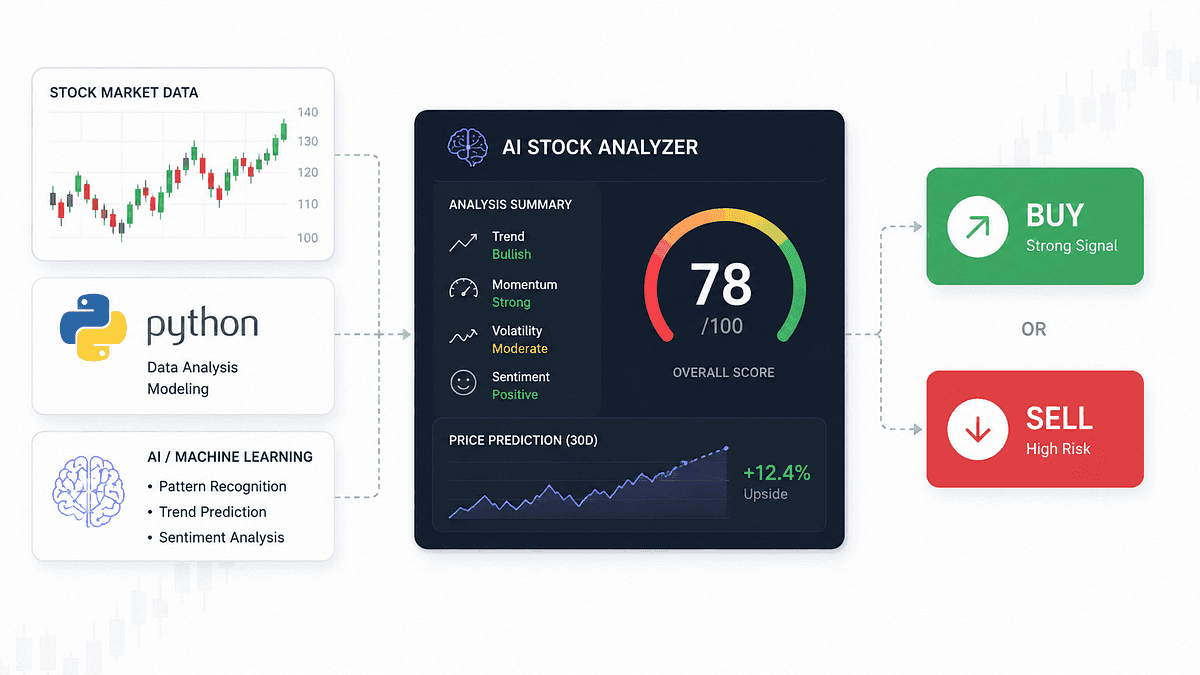
Most stock analysis tools give you a number and expect you to trust it.
You type in a ticker, a black box does something, and out comes a “Buy” or a “Sell.” No explanation. No visibility into what drove the score. No way to check if the model just rewarded a company for one flashy metric while ignoring three warning signs.
That’s backwards. A useful analysis tool should make you a better analyst, not replace your judgment with someone else’s opinion dressed up as math.
If you’re:
a developer who wants to combine financial APIs with an LLM,
an investor tired of jumping between ten browser tabs to piece together a thesis,
or someone building fintech tools who needs a transparent scoring system instead of a mystery number,
this is for you.
How to analyze a stock before buying
Here’s what actually happens when most people try to analyze a stock before buying it.
They open the ticker on a broker app. They see the P/E ratio. They Google “is [ticker] a good stock.” They read three contradictory takes on Reddit. They close the laptop more confused than when they started.
The problem isn’t a lack of data. Data is everywhere now, free APIs, broker apps, financial news sites.
The problem is that nobody structures it.
Growth without valuation context looks exciting. Valuation without quality context looks cheap for a reason. A single “Buy” rating from an anonymous analyst tells you nothing about the underlying business.
Stock analysis doesn’t need more information. It needs a framework that forces every piece of data to answer one specific question, and then combines those answers honestly.
That’s what we’re building here: a Python tool that pulls real financial data through EODHD, scores a company across five dimensions, and hands the interpretation (not the math) to Claude. By the end, you’ll have working code you can point at any ticker.
The 5 factors that matter most
Every investment decision, whether you realize it or not, comes down to five questions.
Business quality. Does this company convert revenue into real profit and cash, consistently?
Growth. Is the business actually getting bigger, or did one good quarter skew the picture?
Financial health. Could this company survive a bad year without breaking?
Valuation. Are you paying a fair price for what you’re getting, or a premium for a good story?
Momentum. Is the trajectory improving, holding steady, or rolling over?
Related articles
None of these questions has a single right answer. But each one has a defensible, calculable score, and that’s the difference between an opinion and an analysis.
Getting financial data with EODHD
I’ve tested a handful of financial data providers for projects like this, and I keep coming back to EODHD for one reason: one API call gets you fundamentals, financial statements, earnings history, and analyst estimates for a single ticker instead of stitching together five different endpoints.
Through the fundamentals endpoint, a single request returns:
Full income statement, balance sheet, and cash flow statement (quarterly and yearly)
Earnings history with actual vs. estimated EPS and surprise percentage
Analyst ratings and price targets
Here’s the function everything else in this tool builds on:
import os
import requests
EODHD_API_KEY = os.environ.get("EODHD_API_KEY", "demo")
BASE_URL = "https://eodhd.com/api"

def get_fundamentals(ticker: str) -> dict:
    """Pull the full fundamentals payload for a single ticker."""
    url = f"{BASE_URL}/fundamentals/{ticker}"
    params = {"api_token": EODHD_API_KEY, "fmt": "json"}
    resp = requests.get(url, params=params, timeout=30)
    resp.raise_for_status()
    return resp.json()
Everything downstream (quality, growth, health, valuation, momentum) reads from this same payload. No extra round trips.
Get the data behind this analyzer
EODHD gives you fundamentals, full financial statements, and analyst estimates through one API, with a free tier to test against. →Start with EODHD
Three small helpers do the repetitive work across every scoring function below: pulling a field across several fiscal years, normalizing a raw number into a 0–100 sub-score, and checking whether a metric grew consistently.
def yearly_series(f, statement, field, n=6):
    data = f["Financials"][statement]["yearly"]
    dates = sorted(data.keys())[-n:]
    return [(d, float(data[d][field])) for d in dates if data[d].get(field) is not None]
def latest_yearly(f, statement):
    data = f["Financials"][statement]["yearly"]
    return data[sorted(data.keys())[-1]]

def normalize(value, floor, ceiling):
    """Linear-scale a raw metric into a 0-100 sub-score."""
    if value is None:
        return None
    score = (value - floor) / (ceiling - floor) * 100
    return max(0, min(100, score))

def growth_consistency(values):
    """Share of consecutive periods that grew. 1.0 = grew every year."""
    if len(values) < 2:
        return None
    ups = sum(1 for i in range(1, len(values)) if values[i] > values[i - 1])
    return ups / (len(values) - 1)
Every scoring function from here on assumes these four are already imported.
Step 1: Measuring business quality
A company can grow revenue every year and still be a bad business, if that growth never turns into real profit or cash.
Business quality answers a narrower question: when this company makes a sale, how much of it actually sticks?
We measure six things:
Return on equity (ROE), how efficiently the company turns shareholder capital into profit
Operating margin, profitability from core operations, before financing and tax noise
Net margin, what’s left after everything
Free cash flow margin, the percentage of revenue that becomes cash the company can actually use, for buybacks, debt paydown, or reinvestment
FCF consistency, whether free cash flow grew most years or spiked once and reversed
Profit consistency, the share of the last several years the company was actually profitable
That last two matter more than people give them credit for. A company with one incredible year and four mediocre ones isn’t high quality. It got lucky once.
def calculate_quality_score(f: dict) -> dict:
    h = f["Highlights"]
    revenue = yearly_series(f, "Income_Statement", "totalRevenue")
    fcf = yearly_series(f, "Cash_Flow", "freeCashFlow")
    net_income = yearly_series(f, "Income_Statement", "netIncome")
    roe = h.get("ReturnOnEquityTTM") or 0
    op_margin = h.get("OperatingMarginTTM") or 0
    net_margin = h.get("ProfitMargin") or 0
    fcf_margin = fcf[-1][1] / revenue[-1][1] if revenue and fcf else None
    fcf_consistency = growth_consistency([v for _, v in fcf])
    profit_consistency = sum(1 for _, v in net_income if v > 0) / len(net_income)
    sub_scores = {
        "roe": normalize(roe, 0.0, 0.40),
        "operating_margin": normalize(op_margin, 0.0, 0.45),
        "net_margin": normalize(net_margin, 0.0, 0.35),
        "fcf_margin": normalize(fcf_margin, 0.0, 0.35),
        "fcf_consistency": normalize(fcf_consistency, 0.0, 1.0),
        "profit_consistency": normalize(profit_consistency, 0.0, 1.0),
    }
    weights = {"roe": .20, "operating_margin": .20, "net_margin": .15,
               "fcf_margin": .15, "fcf_consistency": .15, "profit_consistency": .15}
    final = sum(sub_scores[k] * weights[k] for k in sub_scores)
    return {"score": round(final), "components": sub_scores}
normalize() maps a raw metric to a 0-100 sub-score using a floor and ceiling. A 40% ROE gets a full 100. A 0% or negative ROE gets 0. Everything between is linear. No metric can single-handedly push the score to 100. It gets weighted and averaged with five others, which is the entire point: one great number doesn't hide four mediocre ones.
Step 2: Measuring growth
Growth is where most “AI stock analysis” tools quietly cheat. They see a big quarterly EPS number and treat it as proof of a thriving business.
Sometimes it is. Sometimes it’s a one-time gain from selling an asset, a tax credit, or marking an equity stake up in value, none of which tells you anything about whether the core business is expanding.
We look at five signals: quarterly revenue growth, 3-year revenue CAGR (which smooths out any single lumpy quarter), quarterly EPS growth, free cash flow growth, and revenue consistency across the last several fiscal years.
The EPS growth number gets one important adjustment: it’s capped.
def calculate_growth_score(growth: dict) -> dict:
    # One-off items (asset sales, equity stakes, tax credits) can distort
    # quarterly EPS by 100%+ without reflecting the underlying business.
    # Capping prevents those spikes from dominating the score.
    eps_yoy = growth["eps_growth_yoy"]
    eps_yoy_capped = max(-0.5, min(eps_yoy, 0.60)) if eps_yoy is not None else None
    sub_scores = {
        "revenue_growth": normalize(growth["revenue_growth_yoy"], -0.05, 0.35),
        "revenue_cagr_3y": normalize(growth["revenue_cagr_3y"], 0.0, 0.35),
        "eps_growth": normalize(eps_yoy_capped, -0.20, 0.40),
        "fcf_growth": normalize(growth["fcf_growth_yoy"], -0.20, 0.40),
        "consistency": normalize(growth["revenue_consistency"], 0.0, 1.0),
    }
    weights = {"revenue_growth": .20, "revenue_cagr_3y": .25, "eps_growth": .20,
               "fcf_growth": .20, "consistency": .15}
    final = sum(sub_scores[k] * weights[k] for k in sub_scores)
    return {"score": round(final), "components": sub_scores}
A stock that reports 300% EPS growth off a one-time gain shouldn’t automatically outscore a company compounding revenue at a steady 20% a year. The cap keeps the score honest. You’ll see exactly why this matters later, when we compare two real companies.
Step 3: Checking financial health
Growth and quality tell you if a business is good. Financial health tells you if it can survive being wrong about something.
Every recession, rate hike, or bad product cycle eventually tests a company’s balance sheet. The ones with too much debt and too little cash get forced into bad decisions, cutting R&D, diluting shareholders, selling assets at the worst possible time.
def calculate_financial_health_score(f: dict) -> dict:
    bs = latest_yearly(f, "Balance_Sheet")
    fcf = yearly_series(f, "Cash_Flow", "freeCashFlow")[-1][1]
    equity = float(bs.get("totalStockholderEquity") or 0)
    lt_debt = float(bs.get("longTermDebt") or 0)
    current_assets = float(bs.get("totalCurrentAssets") or 0)
    current_liab = float(bs.get("totalCurrentLiabilities") or 1)
    cash = float(bs.get("cash") or 0) + float(bs.get("shortTermInvestments") or 0)
    ebitda = f["Highlights"].get("EBITDA") or 0
    debt_to_equity = lt_debt / equity if equity else None
    current_ratio = current_assets / current_liab
    net_debt_to_ebitda = (lt_debt - cash) / ebitda if ebitda else None
    fcf_to_debt = fcf / lt_debt if lt_debt else 1.0
    sub_scores = {
        "debt_to_equity": 100 - normalize(debt_to_equity, 0.0, 1.0),
        "current_ratio": normalize(current_ratio, 0.5, 3.0),
        "net_debt_to_ebitda": 100 - normalize(net_debt_to_ebitda, -1.0, 3.0),
        "fcf_to_debt": normalize(fcf_to_debt, 0.0, 2.0),
        "cash_cushion": normalize(cash / current_liab, 0.0, 3.0),
    }
    weights = {"debt_to_equity": .25, "current_ratio": .20, "net_debt_to_ebitda": .20,
               "fcf_to_debt": .20, "cash_cushion": .15}
    final = sum(sub_scores[k] * weights[k] for k in sub_scores)
    return {"score": round(final), "components": sub_scores}
Two things worth explaining: debt-to-equity and net-debt-to-EBITDA are inverted (100 - normalize(...)) because for these metrics, lower is better. A company with negative net debt (more cash than debt) scores near the top. A highly leveraged company scores near the bottom, regardless of how fast it's growing.
Step 4: Is the stock expensive or cheap?
This is the step most stock analysis Python tutorials skip entirely, and it’s the one that matters most.
A 91/100 quality score means nothing if you’re paying a 60x P/E for it. Valuation isn’t a judgment on the company. It’s a judgment on the price you’d pay today, relative to what the business is actually delivering.
We look at forward P/E, PEG (P/E adjusted for expected growth), EV/EBITDA (capital-structure-neutral, useful for comparing companies with different debt levels), Price-to-Free-Cash-Flow, and Price-to-Sales.
def calculate_valuation_score(f: dict) -> dict:
    v, h = f["Valuation"], f["Highlights"]
    fcf = yearly_series(f, "Cash_Flow", "freeCashFlow")[-1][1]
    price_fcf = h["MarketCapitalization"] / fcf
    # Lower is cheaper for every one of these metrics, so the normalized
    # score gets inverted: a lower P/E produces a HIGHER valuation score.
    sub_scores = {
        "forward_pe": 100 - normalize(v.get("ForwardPE"), 10, 40),
        "peg": 100 - normalize(h.get("PEGRatio"), 0.5, 2.5),
        "ev_ebitda": 100 - normalize(v.get("EnterpriseValueEbitda"), 8, 25),
        "price_fcf": 100 - normalize(price_fcf, 15, 45),
        "price_sales": 100 - normalize(v.get("PriceSalesTTM"), 2, 12),
    }
    weights = {"forward_pe": .20, "peg": .25, "ev_ebitda": .20,
               "price_fcf": .20, "price_sales": .15}
    final = sum(sub_scores[k] * weights[k] for k in sub_scores)
    return {"score": round(final), "components": sub_scores}
Here’s the rule that governs this entire section: a high-quality company should never automatically receive a high valuation score. They’re answering different questions. One asks “is this a good business.” The other asks “am I paying a fair price for it today.” A great company and a great investment are not the same claim.
Step 5: Are fundamentals improving or deteriorating?
The momentum score isn’t a trading signal. It’s not trying to predict next week’s price.
It’s asking something simpler: right now, is this company’s trajectory pointing up, flat, or down?
We combine five signals: where the 50-day moving average sits within the 52-week range, whether the 50-day average is above or below the 200-day average (a basic trend filter), the average earnings surprise over the last four reported quarters, quarterly revenue growth, and the share of analysts rating the stock Buy or Strong Buy.
def calculate_momentum_score(f: dict) -> dict:
    t, h = f["Technicals"], f["Highlights"]
    reported = sorted(
        [(d, v) for d, v in f["Earnings"]["History"].items()
         if v.get("surprisePercent") is not None],
        reverse=True,
    )[:4]
    avg_surprise = sum(v["surprisePercent"] for _, v in reported) / len(reported)
    ratings = f["AnalystRatings"]
    total = sum(ratings.get(k, 0) for k in
                ["StrongBuy", "Buy", "Hold", "Sell", "StrongSell"])
    analyst_skew = (ratings.get("StrongBuy", 0) + ratings.get("Buy", 0)) / total
    price_position = (t["50DayMA"] - t["52WeekLow"]) / (t["52WeekHigh"] - t["52WeekLow"])
    trend = 70 if t["50DayMA"] > t["200DayMA"] else 30
    sub_scores = {
        "price_position": normalize(price_position, 0.0, 1.0),
        "trend": trend,
        "earnings_surprise": normalize(avg_surprise, -15, 15),
        "revenue_growth": normalize(h.get("QuarterlyRevenueGrowthYOY"), -0.05, 0.30),
        "analyst_skew": normalize(analyst_skew, 0.4, 1.0),
    }
    weights = {"price_position": .20, "trend": .20, "earnings_surprise": .25,
               "revenue_growth": .20, "analyst_skew": .15}
    final = sum(sub_scores[k] * weights[k] for k in sub_scores)
    label = "Improving" if final >= 65 else "Stable" if final >= 45 else "Deteriorating"
    return {"score": round(final), "label": label, "components": sub_scores}
Keep the earnings-surprise caveat in mind. It’s the same problem from Step 2, showing up again: a huge surprise percentage can come from a one-off gain instead of real operating strength. We’ll see exactly that in the comparison below.
Building the investment score
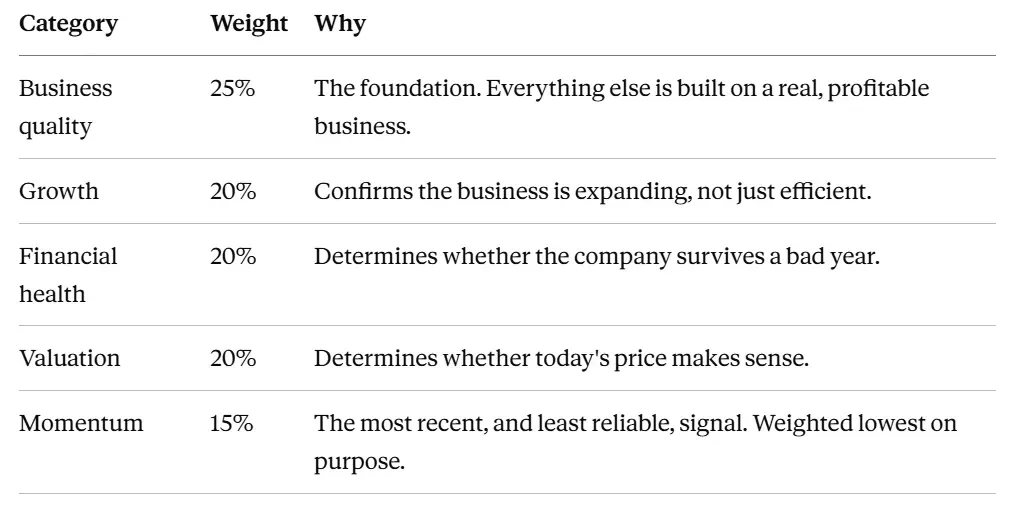
Each of the five scores gets its own weight in the final number:
Category
Weight
Why
Business quality
25%
The foundation. Everything else is built on a real, profitable business.
Growth
20%
Confirms the business is expanding, not just efficient.
Financial health
20%
Determines whether the company survives a bad year.
Valuation
20%
Determines whether today’s price makes sense.
Momentum
15%
The most recent, and least reliable, signal. Weighted lowest on purpose.
Missing data doesn’t break the calculation. Every sub-score function only averages the components that actually came back from the API. A missing PEG ratio (common for unprofitable companies) just gets excluded from the valuation average instead of silently defaulting to zero or crashing the script.
Using Claude to interpret the results
This is the part where a lot of “AI stock analyzer” projects go wrong. They ask an LLM to output a score directly, which means the score is whatever the model felt like generating that day, not something you can audit or reproduce.
Here, Claude never sees raw financial statements and never invents a number. It receives the finished scores as structured JSON and writes the plain-language explanation around them.
import anthropic
client = anthropic.Anthropic()
def interpret_report(report: dict) -> str:
    prompt = f"""
You are a financial analyst explaining a stock scoring report to a retail investor.
Do not change or second-guess the scores below. Use them as ground truth.
{report}
Write four short sections:
1. What the company does well
2. Where it's weak
3. The single biggest risk right now
4. What would need to change for the thesis to strengthen or weaken
Do not recommend buying or selling. Describe trade-offs, not conclusions.
"""
    response = client.messages.create(
        model="claude-sonnet-4-6",
        max_tokens=800,
        messages=[{"role": "user", "content": prompt}],
    )
    return response.content[0].text
The division of labor matters here. Python does the math because math should be reproducible: run it twice, get the same score. Claude does the writing because language is where an LLM actually adds value, translating five numbers and a dozen ratios into something a human can act on.
META: complete stock analysis example
Let’s run this against a real ticker. Here’s what the analyzer returns for META, pulled live from EODHD:
META: Investment Analysis
Business Quality      77/100
Growth                47/100
Financial Health      69/100
Valuation             63/100
Momentum              57/100  (Stable)
Overall Score 64/100
Walking through what actually drove each number:
Quality (77/100). META’s ROE sits at 29.85%, operating margin at 34.83%, and it’s been profitable every year in the dataset. This is a genuinely well-run business. The one thing holding the score back from higher is FCF consistency, free cash flow dipped this year, which brings us to growth.
Growth (47/100). Revenue is up 28% year over year, which on its own would score well. But quarterly EPS fell 13.4% and free cash flow dropped nearly 15% from the prior year. The reason is visible right in the cash flow statement: capital expenditures nearly doubled, from $37.3B to $69.7B, as the company pours money into AI infrastructure. That’s not necessarily bad. It’s a bet on future capacity. But it means less cash left over today, and the growth score reflects that honestly instead of only looking at the flattering revenue line.
Financial health (69/100). Debt-to-equity is a conservative 27%, the current ratio is a healthy 2.6x, and the company holds more cash than debt on a net basis. This is a business that can absorb a rough year without financial stress.
Valuation (63/100). A forward P/E of 19.9 and a PEG of 0.89 (below 1.0 generally signals the stock is priced reasonably relative to its growth) are the standout numbers here. Price-to-FCF at roughly 32.6x is the one metric pulling the score down, a direct consequence of that same FCF dip from the capex surge.
Momentum (57/100, Stable). The stock is trading in the lower half of its 52-week range, and the 50-day average sits just below the 200-day average, a mild downtrend. Analyst sentiment stays strongly positive (80% Buy or Strong Buy), and earnings surprises over the last four quarters average a modest 2.6%, mixed between one miss and three beats.
Reading the dashboard together: META remains a high-quality, financially conservative business trading at a reasonable price. The growth dip isn’t a red flag on its own, it’s the visible cost of an infrastructure bet the market hasn’t fully priced in either direction yet. That’s exactly the kind of nuance a single “Buy/Sell” signal would erase.
Comparing two stocks
Running the same analyzer against Alphabet (GOOGL) makes the trade-offs concrete.
META       GOOGL
Quality               77          85
Growth                47          65
Financial Health      69          73
Valuation             63          52
Momentum              57          81
Overall 64 71
Alphabet leads on four of five categories. ROE of 48.7%, revenue that’s grown every year in the dataset without a single down year, and a momentum score boosted by the stock trading near its 52-week high.
But look at valuation: META scores higher (63 vs. 52). Alphabet trades at a Price-to-FCF near 57.7x, close to double META’s 32.6x, and a Price-to-Sales of 9.5 against META’s 6.6. Alphabet is the stronger business on paper right now. It’s also priced like one.
There’s a second thing worth catching here, because it’s exactly the trap Step 2 and Step 5 were built to avoid. Alphabet’s quarterly EPS growth shows up at roughly 294% year over year, and its average earnings surprise over the last four quarters comes in at 87%. Both numbers are almost entirely inflated by one-off gains, not a sudden tripling of the core ad and cloud business. The growth score caps that EPS spike before it can dominate the number. The momentum score doesn’t apply the same cap to earnings surprise, and that’s worth knowing if you’re reading the 81 at face value: some of it is real operating strength, some of it is accounting noise from marked-up investments.
Neither company gets a “winner” label here. Alphabet offers more business strength for a higher price. META offers a smaller margin of safety on quality in exchange for a more reasonable valuation. That trade-off, not a single blended number, is the actual investment decision.
Limitations of AI stock analysis
Worth being direct about what this tool doesn’t do.
It has no view on competitive moats, management quality, or regulatory risk, things that don’t show up cleanly in a financial statement. It’s backward-looking by nature; every ratio here comes from the last reported quarter or year, not from what happens next. Earnings surprises and EPS growth can get distorted by one-time items, as the Alphabet example just showed. And it says nothing about your specific situation: your time horizon, your existing portfolio concentration, your risk tolerance.
This is a starting point for research, not a substitute for it.
Final thoughts
Financial data shouldn’t make the investment decision for you. It should make you better informed when you make it yourself.
A quality score of 91 and a valuation score of 40 aren’t contradictory. They’re two honest answers to two different questions. Learning to hold both in your head at once, instead of collapsing them into a single “Buy” or “Sell,” is most of what separates a systematic investor from someone reacting to whatever headline they read that morning.
FAQs
Is EODHD free to use for this kind of analysis?
EODHD offers a free tier with limited API calls, enough to test the fundamentals endpoint and build a prototype. Production use across many tickers requires a paid plan.
Can I run this on any stock, not just US tickers?
Yes. EODHD covers global exchanges, so the ticker format just needs the right suffix (.US, .LSE, .PA, and so on). The scoring logic itself doesn't change.
Why use Claude instead of just printing the raw scores?
The scores tell you what happened. An LLM is useful for explaining why it might matter and what to watch next, in plain language, without changing the underlying numbers.
How is this different from a stock screener?
A screener filters thousands of stocks by simple thresholds. This tool goes deep on one ticker at a time, explaining the reasoning behind each score instead of just ranking companies against each other.
Build your own version of this analyzer
Every score in this article came from one EODHD API call per ticker: fundamentals, financial statements, earnings history, and analyst estimates in a single response. You’ll get:
Full income statement, balance sheet, and cash flow data, quarterly and yearly
Earnings history with actual vs. estimated EPS and surprise percentage
Building something with financial data?
If you’re an API or fintech company looking to explain your product through practical, code-first content instead of marketing fluff, I write pieces exactly like this one. →See more of my work