I Tested 72 Financial Data Tools in EODHD's MCP Server. These 7 Were the Best.
TL;DR
- Out of the 72 tools on the EODHD MCP server, seven do most of the work:
stock_screener,get_fundamentals_data,get_historical_stock_prices,get_live_price_data,get_technical_indicators,get_upcoming_earningsandget_sentiment_data.- I ran every one against the live API on 8 November 2026. All outputs, charts and code below are real.
- Six of the seven work with EODHD's free demo key on AAPL, TSLA and AMZN. The screener, and fundamentals for your own tickers, need a paid plan.
- The traps:
closevsadjusted_close, an empty RSI when you pass dates, sentiment scores built on 13 articles, and a screener signal that returns OTC listings first.
Connecting Claude to the EODHD MCP server takes five minutes. Then the trouble starts.
You ask a simple question, "is Nvidia expensive right now?", and Claude stares at 72 tool names. It picks one. It burns 5 API calls on a news request you didn't need. With the free plan's 20 calls a day, four of those and you're done until midnight GMT. You ask for an RSI over the last two weeks and get an empty list. You ask for the yearly return and it reads the wrong price column. The answer sounds confident. Half of it is guessed.
I've been testing MCP servers all year. I ranked nine of them in an earlier piece, and EODHD's is the one I connect to Claude most. I've hit every one of those walls.
If you're:
- connecting Claude to market data for the first time,
- building an agent that has to answer real investing questions,
- or tired of paying for calls that return nothing,
this is the short list. Seven tools, what they return, and where they trip you up.
How I tested the 7 best EODHD MCP tools
Each MCP tool on the EODHD server calls one REST endpoint underneath. So instead of showing you screenshots of a chat, I called each endpoint directly, saved the raw JSON, and quote it below. You can run the same calls yourself.
The setup:
- Date run: 8 November 2026 (US market data up to the close of Friday, 6 November)
- Keys: EODHD's public demo key for everything it covers (AAPL, TSLA, AMZN, VTI), a paid key for the screener
- Tickers: AAPL.US for most tests, TSLA.US and AMZN.US for earnings, the 10 largest US tech stocks for the screener
1. stock_screener: the question before the question
Most investing questions start with "which stocks?". The screener answers that in one call, and it's the tool I'd keep if I could only keep one.
I asked for the 10 largest US technology stocks by market cap. Each row comes back with price, market cap, EPS, dividend yield and returns over 1 day and 5 days. That last column told the story of the week on its own:
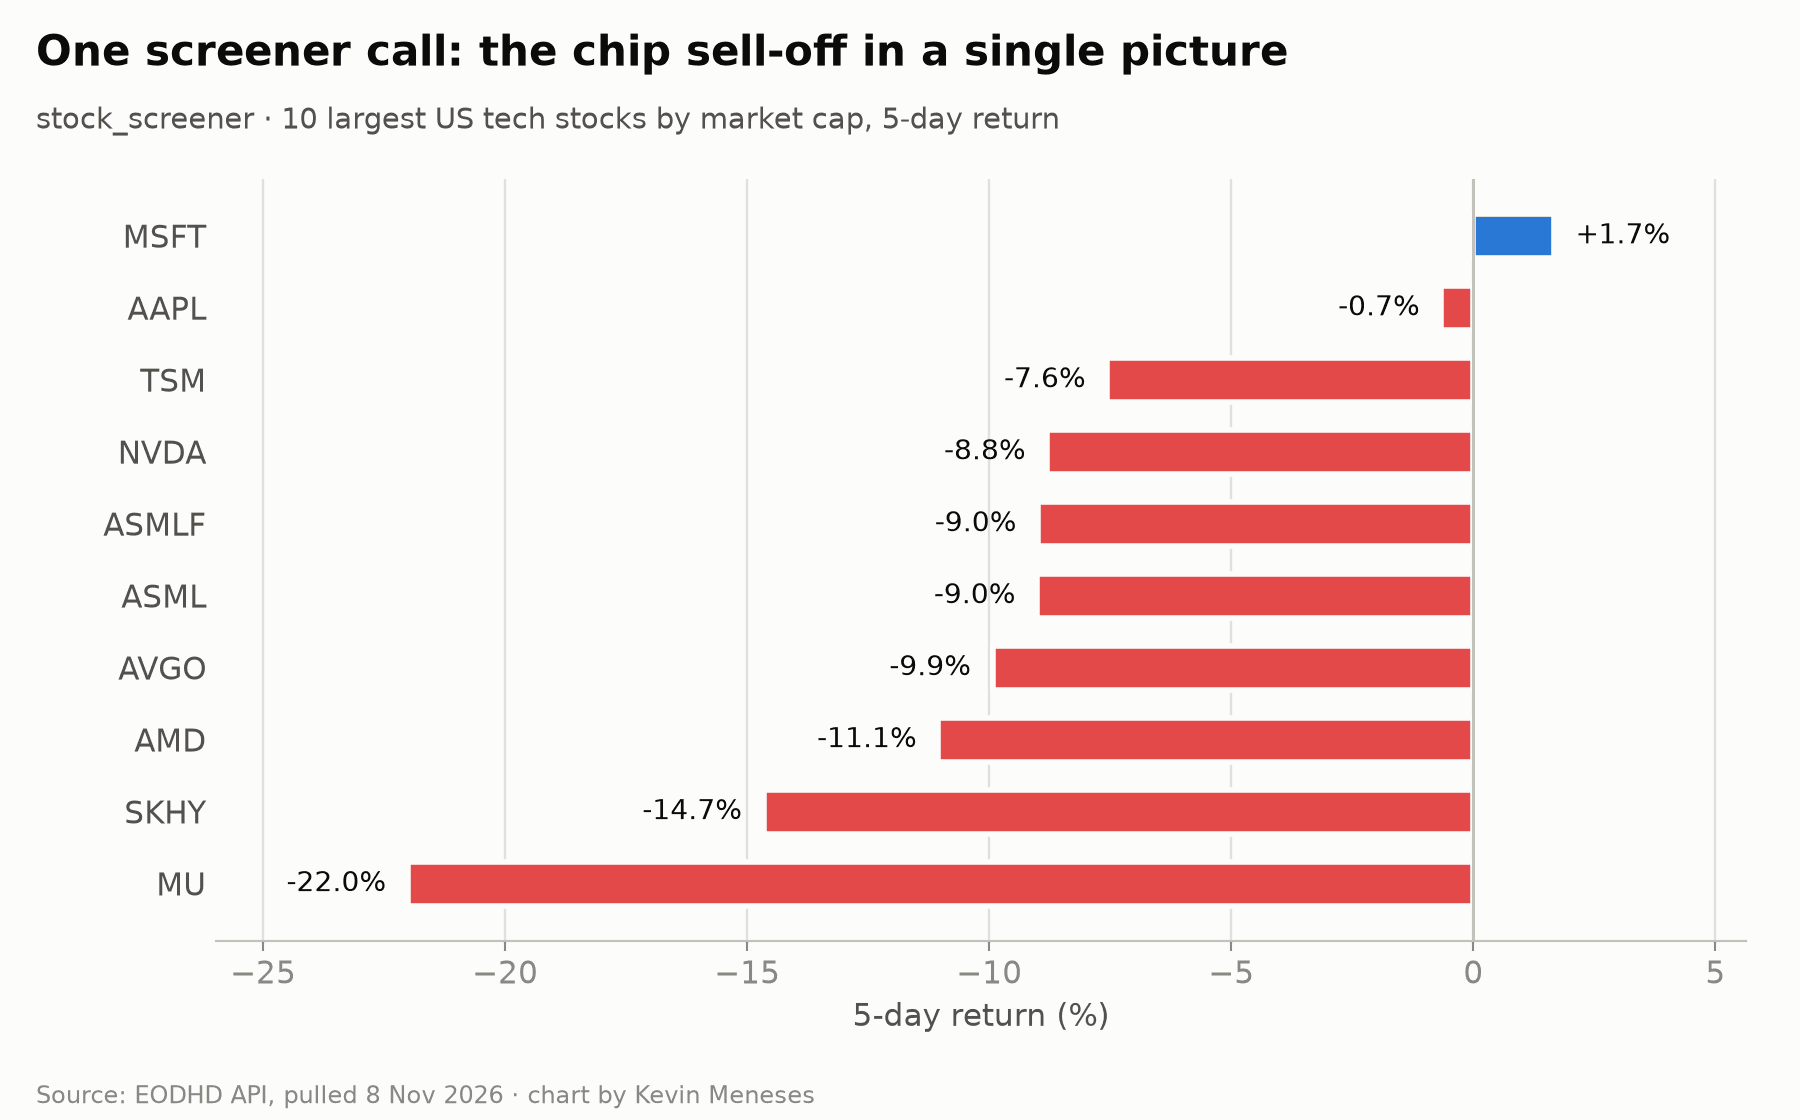
Micron fell 22.0% in five days, SK Hynix 14.7%, AMD 11.1%. Microsoft was the only one up (+1.7%). Apple barely moved (-0.7%). One request, and you can see the chip sell-off before reading a single headline.
Two things to know:
- ASML shows up twice (ASML and ASMLF), because both US listings pass the filter. Deduplicate before you count.
- Signals are powerful but noisy. When I swapped the sector filter for the
200d_new_hisignal across all US stocks above $10 billion, all five results were foreign OTC listings (Postal Savings Bank of China, BCE, Amundi…) with a 0% 5-day move. Sanity-check the tickers before you hand the list to Claude.
It costs 5 API calls per request and needs the EOD + Intraday All-World Extended plan or higher. The demo key returns 403.
Best for: building a shortlist, watchlists, "what moved this week?".
2. get_fundamentals_data: the whole company in one call
This is the tool Claude calls most when I ask "is this stock expensive?". One request returns valuation, margins, growth, analyst estimates and more.
For AAPL.US, filtered to the Highlights and Valuation sections:
| Metric | Value |
|---|---|
| Market cap | $4.98 trillion |
| P/E (trailing) | 38.13 |
| P/E (forward) | 35.71 |
| Profit margin | 27.6% |
| Quarterly revenue growth (YoY) | 11.7% |
| Quarterly earnings growth (YoY) | 14.1% |
| Analyst target price | $339.04 |
| Most recent quarter | 2026-09-30 |
The useful detail: the analyst target ($339.04) sits slightly below the last close ($342.37). You notice that because both numbers arrive in the same payload.
The catch is cost. Each fundamentals request is 10 API calls. Filter to the sections you need, and tell Claude not to call it for every ticker on a list.
Best for: valuation questions, quick company summaries, checking a shortlist by hand.
3. get_historical_stock_prices: the backbone of every backtest
Daily, weekly or monthly OHLCV, with both the raw close and the adjusted close. I asked for monthly bars over the last year:
| Month | Close | Adjusted close |
|---|---|---|
| 2025-11 | 278.85 | 278.09 |
| 2026-01 | 259.48 | 258.78 |
| 2026-05 | 312.06 | 311.79 |
| 2026-09 | 333.02 | 333.02 |
| 2026-11 (partial) | 342.37 | 342.37 |
On adjusted prices, that's a 23.1% gain from November 2025 to now. On raw closes it's 22.8%. The gap is the dividends.
Pick the right column. If Claude reads close instead of adjusted_close, it understates the return on any stock that pays dividends. On a stock that split, the gap is much larger. I tell Claude explicitly to use adjusted_close for returns.
Best for: returns, drawdowns, charts, backtests.
4. get_live_price_data: what's the price right now
The simplest tool on the list, and the one that stops Claude from guessing a price from its training data.
{"code":"AAPL.US","timestamp":1794000540,"open":338.73,"high":345.79,
 "low":338.3,"close":342.37,"previousClose":344.17,"change":-1.8,"change_p":-0.523}
The timestamp converts to 6 November 2026, 21:29 UTC, after Friday's close. Live prices are 15-minute delayed on the EOD plans. Fine for analysis, wrong for trading.
The cross-check I liked: the live close (342.37) matches the November bar from tool 3 and the screener row from tool 1. Three tools, one number.
Best for: anchoring any analysis to today's price.
5. get_technical_indicators: RSI, SMA and more without writing the maths
RSI, SMA, EMA, MACD, Bollinger Bands, ATR, ADX and others, computed server-side. Each request costs 5 API calls.
For AAPL.US on 6 November:
- RSI(14): 51.46, neutral, neither overbought nor oversold
- SMA(200): 298.54, so the price sits 14.7% above its long-term trend
The trap I fell into: when I passed a two-week from/to window to the RSI request, it came back as an empty list. Without the date range, sorted descending (order=d), it returned the full series. If Claude reports "no data" for an indicator, ask it to retry without the dates.
Best for: trend and momentum checks, signal scripts.
Run it yourself
Here's the four-tool snapshot I now use before reading any stock. It ran as-is with the demo key:
import requests

API = "https://eodhd.com/api"
KEY = "demo"  # covers AAPL.US, TSLA.US, AMZN.US, VTI.US
TICKER = "AAPL.US"

def get(path, **params):
    r = requests.get(f"{API}/{path}", params={"api_token": KEY, "fmt": "json", **params}, timeout=30)
    r.raise_for_status()
    return r.json()

live = get(f"real-time/{TICKER}")
rsi = get(f"technical/{TICKER}", function="rsi", period=14, order="d")[0]
sma = get(f"technical/{TICKER}", function="sma", period=200, order="d")[0]
val = get(f"fundamentals/{TICKER}", filter="Valuation")

print(f"Price      {live['close']:.2f} ({live['change_p']:+.2f}%)")
print(f"RSI(14)    {rsi['rsi']:.1f}  on {rsi['date']}")
print(f"SMA(200)   {sma['sma']:.2f}  -> price {live['close'] / sma['sma'] - 1:+.1%} vs trend")
print(f"P/E        {val['TrailingPE']:.1f} trailing, {val['ForwardPE']:.1f} forward")
Output:
Price      342.37 (-0.52%)
RSI(14)    51.5  on 2026-11-06
SMA(200)   298.54  -> price +14.7% vs trend
P/E        38.1 trailing, 35.7 forward
If you'd rather ask Claude in plain English than write the script, the same four tools are one prompt away once the MCP server is connected. 👉 Get your EODHD key here. Use the code KEVIN10 at checkout for 10% off.
6. get_upcoming_earnings: dates, beats and misses
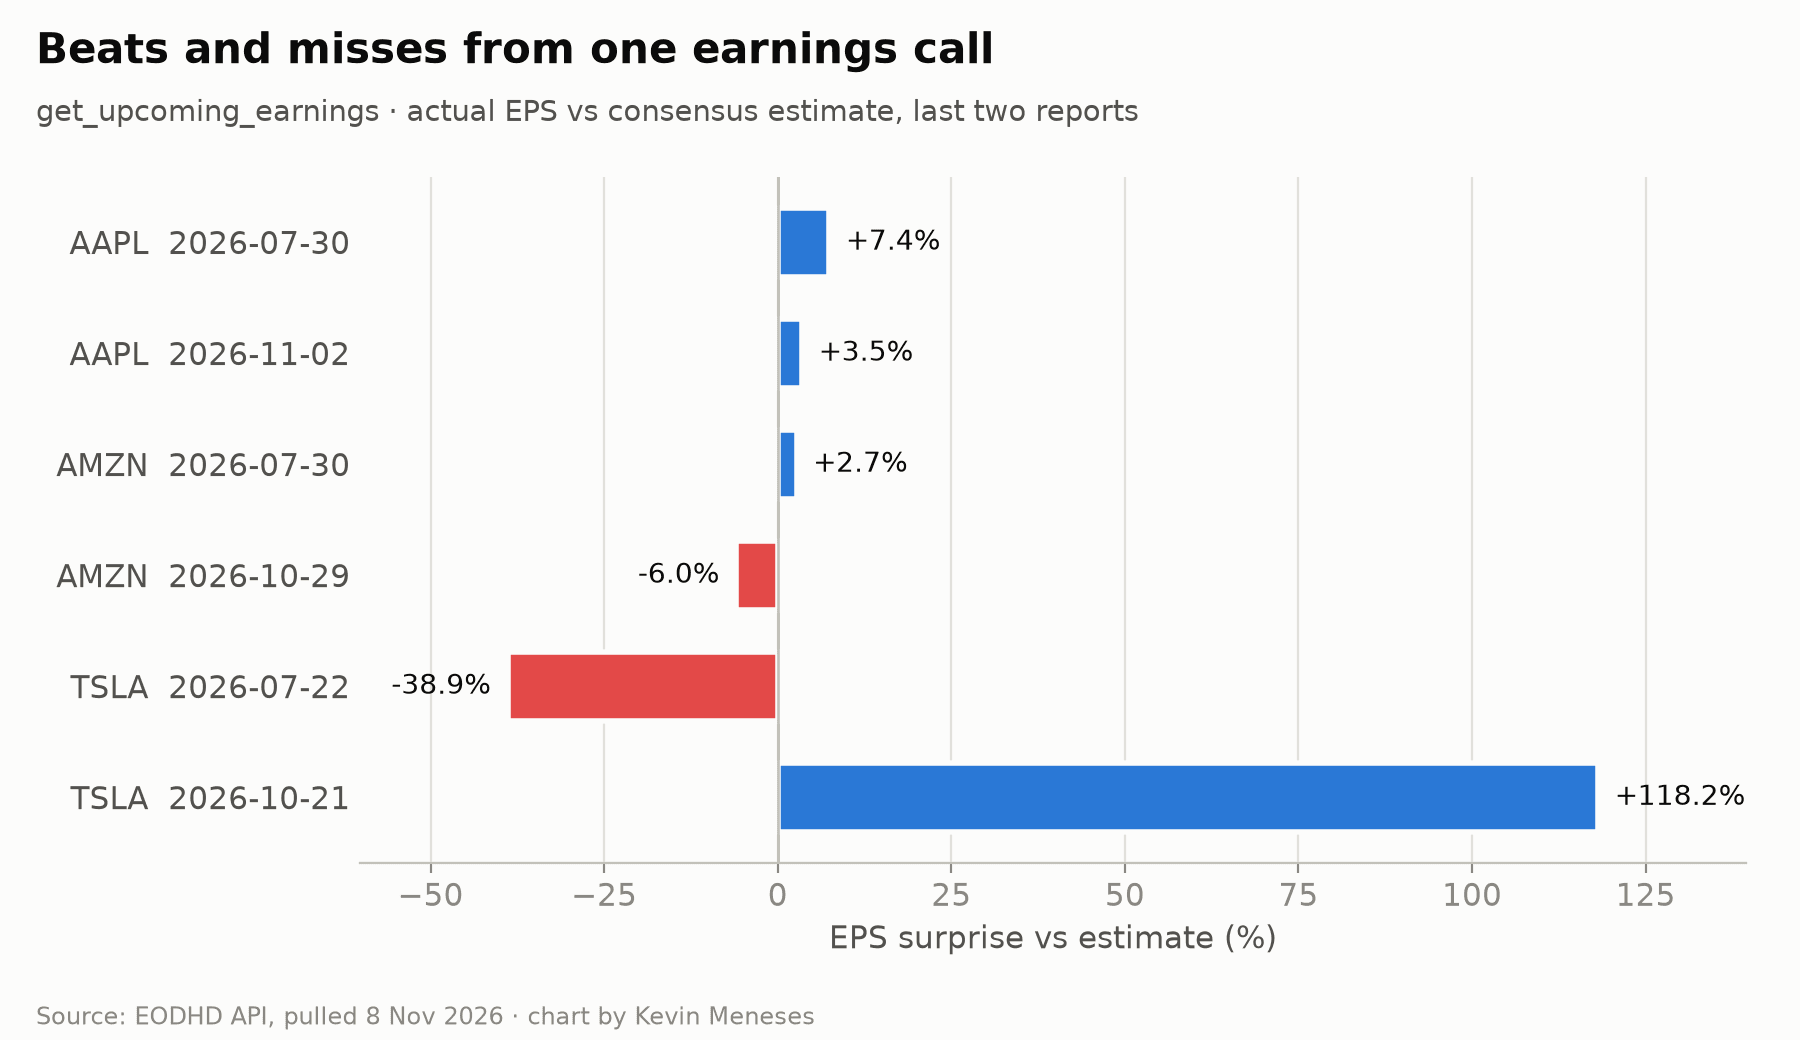
The name undersells it. Besides dates, it returns the EPS estimate, the actual figure and the surprise. I asked for AAPL, TSLA and AMZN from July 2026 to March 2027:
| Ticker | Report date | EPS estimate | EPS actual | Surprise |
|---|---|---|---|---|
| AAPL | 2026-07-30 | 1.88 | 2.02 | +7.4% |
| AAPL | 2026-11-02 | 1.98 | 2.05 | +3.5% |
| TSLA | 2026-07-22 | 0.54 | 0.33 | -38.9% |
| TSLA | 2026-10-21 | 0.22 | 0.48 | +118.2% |
| AMZN | 2026-07-30 | 1.83 | 1.88 | +2.7% |
| AMZN | 2026-10-29 | 2.01 | 1.89 | -6.0% |
Look at Tesla. A 38.9% miss followed by a 118.2% beat. The second number is mostly the estimate collapsing from 0.54 to 0.22, not earnings exploding. Claude explains that well, but only when it has the raw estimate next to the actual.
One limit: my window ran to March 2027, but no future dates came back for these three. Upcoming dates appear once they're scheduled, so a query far ahead can return only past quarters.
Best for: earnings-season prep, "did they beat?" questions.
7. get_sentiment_data: a daily mood score from the news
A daily sentiment score per ticker, plus the number of articles behind it. For AAPL.US, the last two weeks ranged from 0.18 to 0.91.
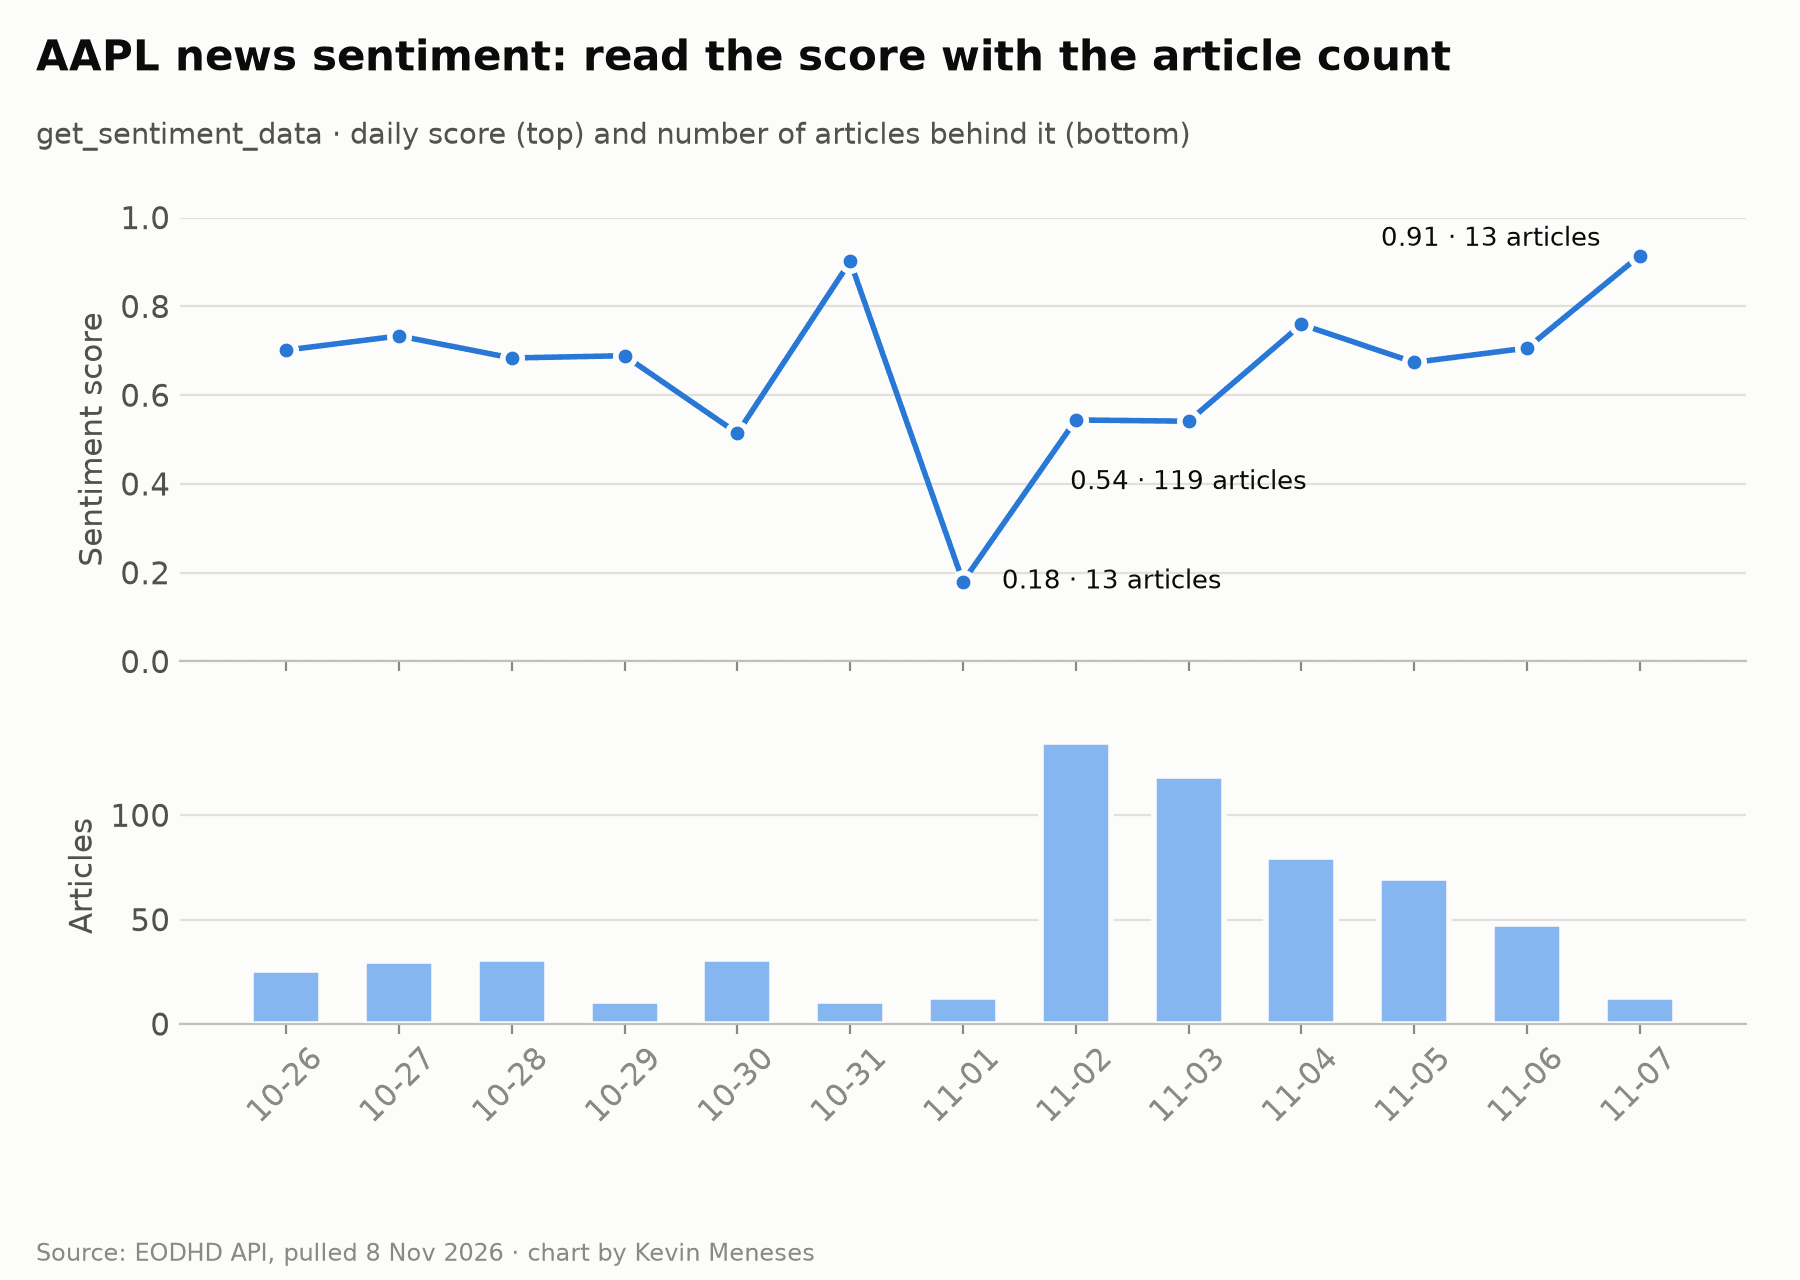
The bottom panel matters as much as the top one:
- 1 November: score 0.18, from 13 articles
- 3 November: score 0.54, from 119 articles
- 7 November: score 0.91, from 13 articles
A 0.91 built on 13 articles over a weekend is weaker evidence than a 0.54 built on 119. I ask Claude to always report both numbers. It doesn't by default.
Best for: spotting a shift in coverage around an event.
The ones that didn't make the cut
get_historical_dividends nearly did. It has the cleanest output on the server: ex-date, record date, payment date and amount. For AAPL you can read the May 2026 raise straight off it ($0.26 to $0.27 a quarter), and the 16 November payment was already listed. It lost its spot to the screener because fewer of my questions need it.
get_insider_transactions is the one I expected to rank. For the window I asked (November 2025 to November 2026), AAPL returned no filings, and for NVDA and TSLA the most recent entries were from March 2026. If you use it for "recent insider buying", check the filing dates before you trust the word "recent".
get_company_news works, but when I asked for AAPL.US news, most headlines were about other companies (Marvell, Gildan, Cisco) that only mention Apple in passing. Use the sentiment tool for the trend, and ask Claude to keep only headlines that name the company in the title.
Which EODHD plan you need
To reproduce tools 2 to 7 for AAPL, TSLA or AMZN, you don't need a plan. The demo key covers them.
For your own tickers:
- Free plan: 20 API calls a day and 1 year of end-of-day history. No fundamentals.
- EOD Historical All-World ($19.99/month): prices, live prices, dividends, news and sentiment, with 30+ years of history.
- EOD + Intraday All-World Extended ($29.99/month): adds technical indicators and the screener.
- Fundamentals Data Feed ($59.99/month) or All-In-One ($99.99/month): needed for
get_fundamentals_data.
Watch the call costs. Fundamentals cost 10 calls per request. News, technicals and the screener cost 5. A Claude session that checks ten stocks can eat a free plan's daily allowance in a couple of questions.
One more thing: it isn't 72 anymore
When I first mapped the server, it had 72 tools. The version I'm connected to today lists around 100: new families for credit spreads, Treasury yields, US options, SEC filings and more. I haven't tested those yet, so they're not in this ranking. They're next on my list.
FAQ
What is the EODHD MCP server? A Model Context Protocol server that lets Claude, ChatGPT or your own agent call EODHD's financial data APIs as tools. The tools fetch data; none of them places orders.
Which EODHD MCP tools are the most useful? In my tests: the stock screener, fundamentals, historical prices, live prices, technical indicators, the earnings calendar and news sentiment.
Does the EODHD MCP server work with the free plan? Yes, within the free plan's limits: 20 calls a day and 1 year of history, without fundamentals. The demo key covers a few tickers with no sign-up.
Can Claude trade through the EODHD MCP server? No. The tools only read data. There's no order path.
Final take
Seventy-two tools is a menu. You don't need the whole menu.
Start with these seven. Look at what each one returns, and tell Claude which column to trust. That gets you most of the way.
👉 Set up the EODHD MCP server with your key. Use the code KEVIN10 at checkout for 10% off.
Not financial advice. The tickers are examples to show what each tool returns.