How to Build an AI Stock Picker in Python You Can Actually Audit
PythonAILLMStock AnalysisStock Screener
Every AI stock picker promises you the next NVIDIA.
None of them shows you why.
You get a score from 1 to 10, a green badge and a "Buy" label. What you don't get is the data behind it, the weights, or a way to check if the model is just chasing whatever went up last quarter.
If you're:
paying for an AI stock picker and wondering what's inside,
a developer building a fintech product,
or a quant-curious investor who wants rules instead of vibes,
This matters.
TL;DR
An AI stock picker is three layers: clean data, a scoring model and an explanation layer. Only the data is hard.
I built one in about 160 lines of Python with EODHD APIs (Screener, Fundamentals, EOD prices, News Sentiment) and ChatGPT.
It ranked 194 US large caps on momentum, quality, growth, value and sentiment. SanDisk (87.6), Micron (85.9) and Dell (82.6) came out on top on November 1, 2026.
The LLM never picks stocks. It only explains picks using numbers we pass in, so it can't invent ratios.
The biggest lesson came from the output itself: 17 of the top 20 picks were tech. A transparent model shows you that. A black box doesn't.
Why most AI stock pickers are black boxes
The best-known AI stock picker apps work the same way. Danelfin, Kavout and Prospero.ai all take thousands of stocks, run them through a proprietary model and hand you a ranking.
That's useful. But there are limits:
You can't see the weights. Is the score 80% momentum? You'll never know.
You can't change the universe. Want only dividend payers or only European stocks? Tough.
"Free" usually means partial. The free AI stock picker tiers tend to hide the top-ranked names behind a paywall.
The alternative most people try next is worse. They open ChatGPT and ask "what are the best stocks to buy right now?"
The model answers with confidence. Sometimes the P/E ratios it quotes are from 2023. Sometimes they're made up.
Neither option gives you a system you can audit.
What an AI stock picker actually is
Strip away the marketing and every AI stock picker does three things:
Collects data on a universe of stocks (prices, fundamentals, news).
Related articles
Scores each stock with a model, from a simple factor ranking to a gradient-boosted tree.
Explains the result in a way a human can act on.
The model is the part everyone talks about. The data is the part that breaks.
Stock picking doesn't need more intelligence. It needs better inputs.
Best AI stock pickers vs building your own
Before writing code, it's worth being honest about the trade-off.
Step 2: Add fundamentals, momentum and news sentiment
Five features per stock. Each one maps to a classic factor:
Feature
Factor
Source
ROE (TTM)
Quality
Fundamentals API
Revenue growth YoY
Growth
Fundamentals API
P/E vs sector median
Value
Fundamentals API
6-1 month return
Momentum
EOD API
30-day news sentiment
Sentiment
Sentiment API
def fundamentals(ticker):
    h = get(f"fundamentals/{ticker}.US", filter="Highlights")
    return {
        "roe": h.get("ReturnOnEquityTTM"),
        "rev_growth": h.get("QuarterlyRevenueGrowthYOY"),
        "margin": h.get("ProfitMargin"),
        "pe": h.get("PERatio"),
    }


def momentum(ticker):
    """6-month return, skipping the most recent month (classic 6-1 momentum)."""
    start = (date.today() - timedelta(days=200)).isoformat()
    px = pd.DataFrame(get(f"eod/{ticker}.US", **{"from": start}))["adjusted_close"]
    if len(px) < 130:
        return None
    return px.iloc[-22] / px.iloc[-130] - 1


def sentiment(tickers):
    """Average news sentiment over the last 30 days."""
    start = (date.today() - timedelta(days=30)).isoformat()
    out = {}
    for i in range(0, len(tickers), 20):
        batch = [f"{t}.US" for t in tickers[i:i + 20]]
        data = get("sentiments", s=",".join(batch), **{"from": start})
        for sym, days in data.items():
            if days:
                out[sym.split(".")[0]] = sum(d["normalized"] for d in days) / len(days)
    return out
Why skip the last month in momentum? Short-term returns tend to mean-revert. The 6-1 window is the standard way to capture trend without that noise.
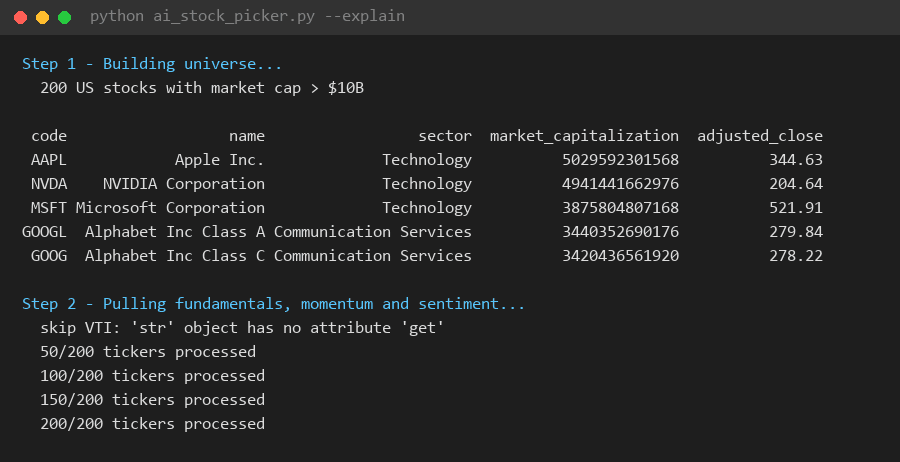
Here's the real output of steps 1 and 2:
One ticker failed: VTI. It's an ETF, so it has no company fundamentals. The try/except skipped it and the run continued with 199 stocks.
Step 3: Score every stock
No neural network here. Each feature becomes a percentile rank (0 to 1), multiplied by a weight. The sum is a score from 0 to 100.
WEIGHTS = {"momentum": 0.25, "quality": 0.25, "growth": 0.20, "value": 0.15, "sentiment": 0.15}


def score(df):
    df = df[df["pe"].fillna(0) > 0].copy()  # drop loss-makers and missing P/E
    df["rel_pe"] = df["pe"] / df.groupby("sector")["pe"].transform("median")

    ranks = pd.DataFrame({
        "momentum": df["momentum"].rank(pct=True),
        "quality": df["roe"].rank(pct=True),
        "growth": df["rev_growth"].rank(pct=True),
        "value": (-df["rel_pe"]).rank(pct=True),
        "sentiment": df["sentiment"].rank(pct=True),
    }).fillna(0.5)

    for f, w in WEIGHTS.items():
        df[f"s_{f}"] = ranks[f] * w * 100
    df["score"] = df[[f"s_{f}" for f in WEIGHTS]].sum(axis=1).round(1)
    return df.sort_values("score", ascending=False).reset_index(drop=True)
Two design choices matter here:
Value is relative to the sector. A P/E of 25 is cheap for a chip designer and expensive for a bank.
Missing data gets a neutral 0.5. A stock isn't punished or rewarded for a gap in coverage.
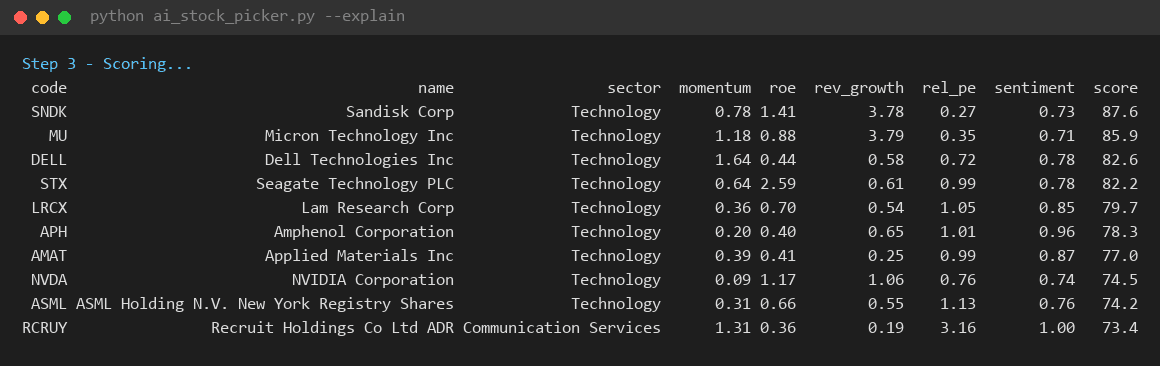
This is the result. 194 stocks survived the P/E filter:
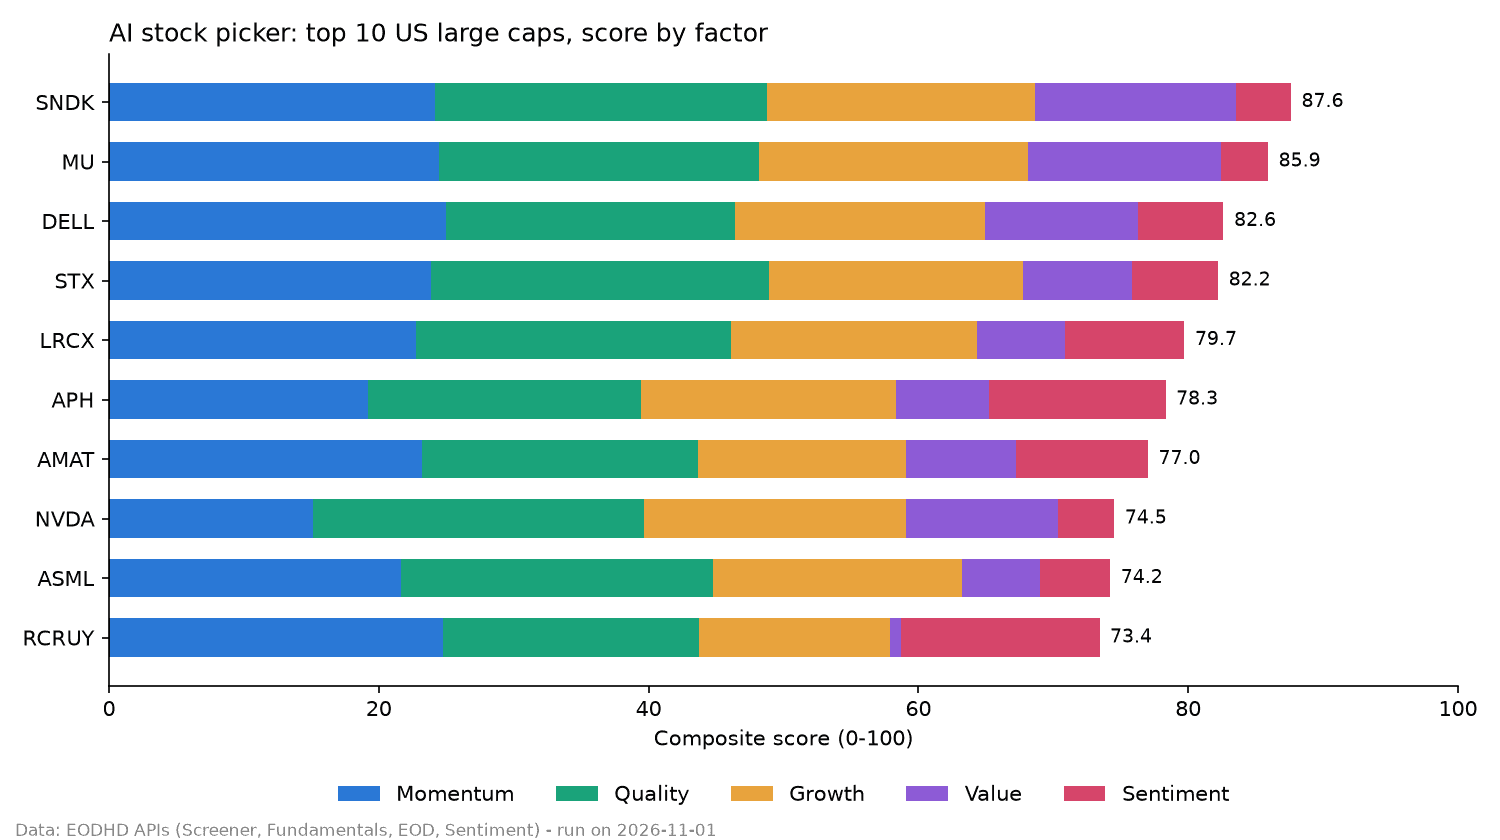
And the same ranking as a chart, so you can see which factor drives each score:
SanDisk and Micron get there with strength on every factor. Recruit Holdings (RCRUY) is the opposite case: top-tier momentum and sentiment, but almost nothing from value. Its P/E is 3.16x its sector median.
That's the kind of insight you never get from a single score.
Step 4: Let the LLM explain, not pick
This is where most "AI stock picker" tutorials go wrong. They ask the LLM to choose stocks.
We do the opposite. The model has already picked. ChatGPT only gets the numbers for one stock and writes the thesis.
from openai import OpenAI


def explain(row):
    facts = {
        "ticker": row["code"], "name": row["name"], "sector": row["sector"],
        "score": row["score"],
        "momentum_6_1": round(row["momentum"], 3),
        "roe_ttm": row["roe"], "revenue_growth_yoy": row["rev_growth"],
        "profit_margin": row["margin"], "pe": row["pe"],
        "pe_vs_sector_median": round(row["rel_pe"], 2),
        "news_sentiment_30d": round(row["sentiment"], 3) if pd.notna(row["sentiment"]) else None,
    }
    prompt = (
        "You are an equity analyst. Using ONLY the data below, write a 4-sentence "
        "investment thesis: why the model ranks this stock highly, and the main risk. "
        "Do not use any number that is not in the data. Ratios are decimals "
        "(0.25 = 25%): write them as percentages.\n\n" + json.dumps(facts, indent=2)
    )
    resp = OpenAI().responses.create(model="gpt-5.4-mini", input=prompt)
    return resp.output_text
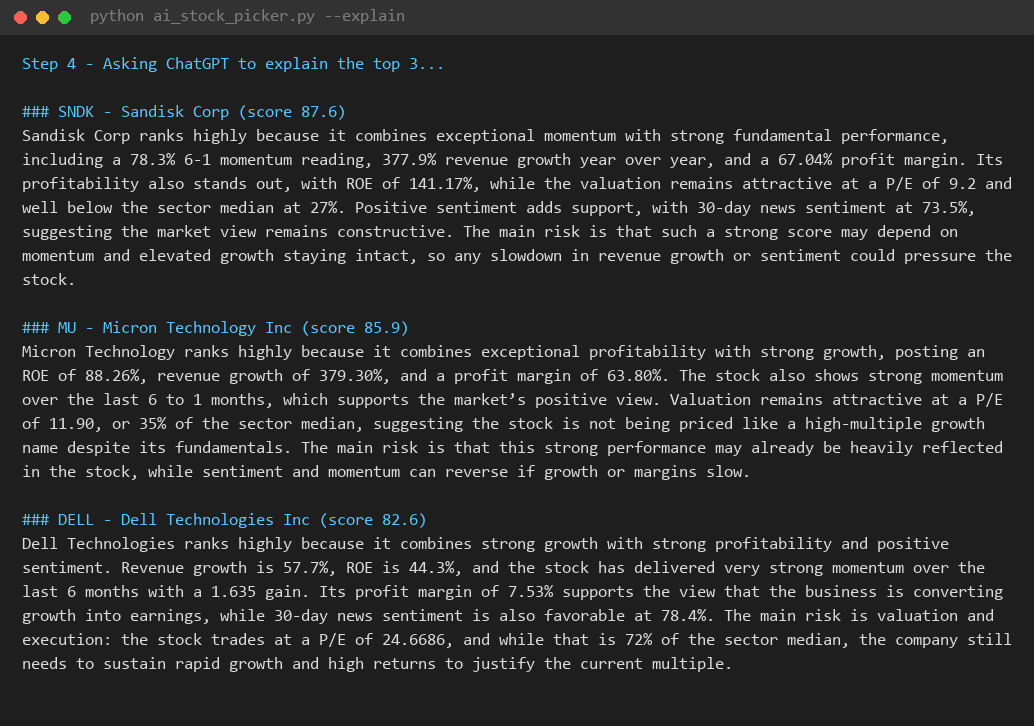
The real output for the top 3:
Read it carefully, because there's a lesson in it.
The theses are grounded. Every number comes from our data. But the LLM still made two small mistakes:
It wrote SanDisk's sentiment score (0.735) as "73.5%". Sentiment isn't a ratio.
It left Dell's momentum as "a 1.635 gain" instead of 163.5%.
No invented P/E ratios. No hallucinated earnings. Just formatting slips that a reviewer catches in seconds.
Constrain the LLM to your data and its errors become cosmetic instead of dangerous.
What the AI stock picker taught me
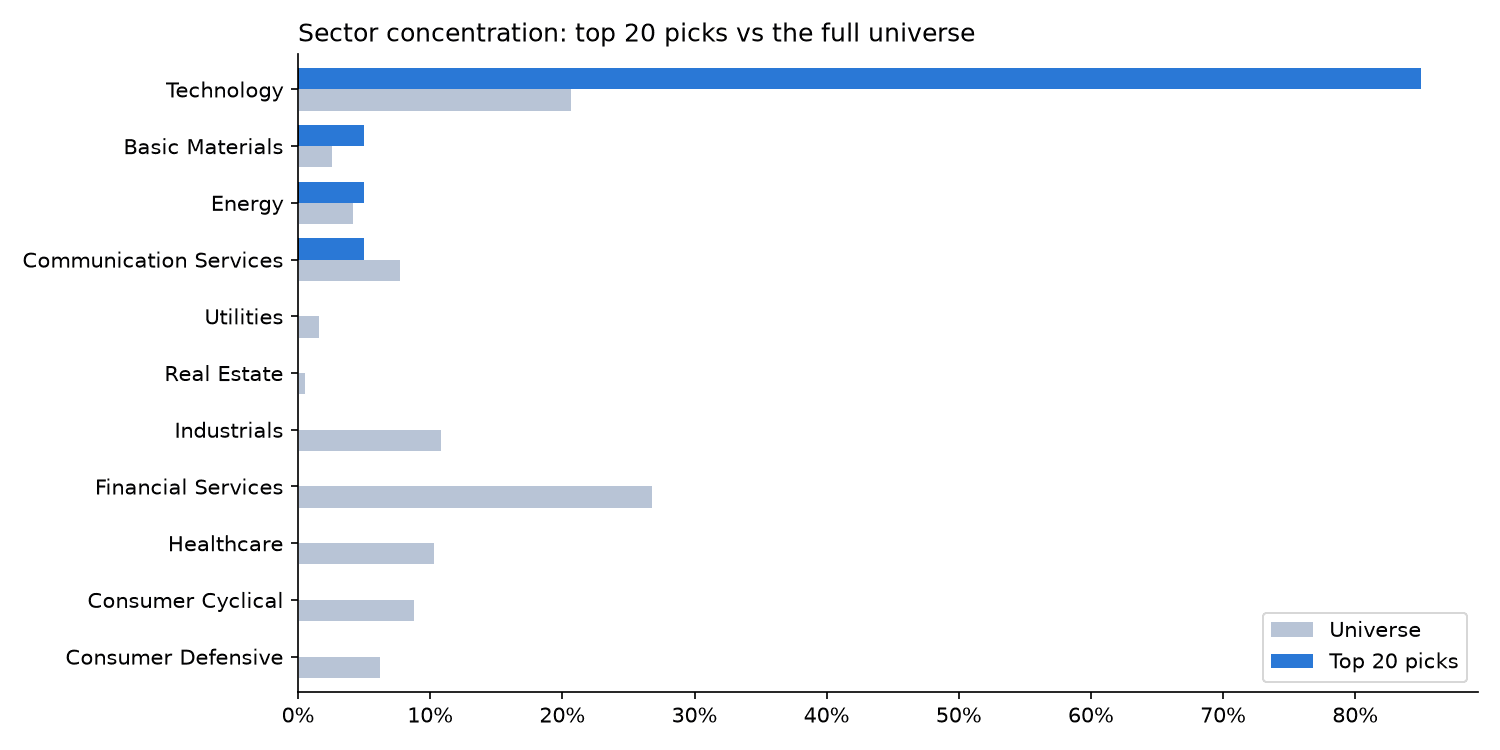
The most useful output wasn't the #1 pick. It was this chart:
Technology is 20.6% of the universe. It's 85% of the top 20 picks (17 out of 20).
The model isn't broken. Memory, storage and semiconductor equipment stocks lead on momentum, growth and sentiment at the same time right now. A factor model rewards exactly that.
But if you bought the top 20 blindly, you wouldn't own a diversified portfolio. You'd own one big bet on the AI hardware cycle.
There's a second, smaller catch. ASML appears twice in the top 20: ASML (the US listing) and ASMLF (the OTC line). Same company, two tickers. Deduplicating by company is a one-line fix once you see it.
A black-box AI stock picker would have shown you neither problem.
From here you can build:
Sector-neutral ranking: score stocks within each sector, then take the top 2 per sector.
Different universes: swap the Screener filter for European stocks, dividend payers or small caps.
A weekly alert: run the script on a schedule and email the top 10.
Limitations to be honest about
This is not a backtest. The scores use today's fundamentals. Testing them on past prices would leak future information. A real backtest needs point-in-time fundamentals and delisted stocks to avoid survivorship bias.
API usage adds up. A full run of 200 stocks costs roughly 2,000+ EODHD API calls, because each fundamentals request counts as 10 calls. The free plan is for testing, not for this.
Weights are a choice, not a truth. 25/25/20/15/15 is a sensible default. Change them and the ranking changes.
Key takeaways
An AI stock picker is data + scoring + explanation. The edge comes from the data, not from the model.
Use the LLM to explain picks from real numbers, never to choose them.
Transparency lets you spot problems, like 85% sector concentration, before they cost you money.
FAQs
❓ Is there a free AI stock picker?
✅ Yes. Prospero.ai offers a free app, and Danelfin and Kavout have free tiers with limited rankings. If you want full control, the Python script in this article is free to run. You only pay for the data API and a few cents of LLM usage.
❓ Can ChatGPT pick stocks?
✅ Not reliably on its own. Without live data, ChatGPT can quote outdated or invented numbers. It works well as an explanation layer when you give it real, current data from an API, like we did in Step 4.
❓ Are AI stock pickers accurate?
✅ No AI stock picker can guarantee returns. Factor models like this one rank stocks on characteristics that have historically mattered (momentum, quality, value), but the only way to judge accuracy is a proper backtest with point-in-time data.
❓ What data does an AI stock picker need?
✅ At minimum: price history for momentum, fundamentals (ROE, growth, valuation) and ideally news sentiment. EODHD covers all of them through one API key.
Final thoughts
Most investors don't need a smarter AI stock picker.
They need one they can see inside.
In the next article of this series, we go from ranking hundreds of stocks to analyzing one in depth: AI stock analysis with an LLM and real financial statements.
👉 Start building with EODHD APIs: Screener, Fundamentals, EOD prices and News Sentiment with one key. Use the code KEVIN10 at checkout for 10% off.
Disclaimer: This article is for educational purposes only and is not investment advice. The rankings shown are the output of an example model on November 1, 2026.