I Automated My Stock Analysis With 5 Claude Features. Here's What Each One Actually Does
Most people use Claude as a chatbot for stock questions.
That's the least useful thing it can do.
I ran five Claude features against the same watchlist of 10 large US tech stocks, with live data from EODHD APIs, and checked every number Claude gave me against the API myself. Short version: with a data connection, Claude got 12 of 12 figures right in the first test, and the backtest it wrote from scratch matched my independent check on every strategy metric. Without the connection it refused to answer, which is better than inventing numbers.
If you're:
- checking the same 10 stocks every morning by hand,
- copy-pasting P/E ratios from five browser tabs,
- or wondering which Claude feature is worth setting up first,
this is for you.
The problem isn't the model
I asked Claude a plain question with no tools connected: the trailing P/E, forward P/E and 14-day RSI for NVDA, PLTR, TSLA and NFLX as of the last close.
It tried to reach the web, couldn't, and came back with no numbers.
"I'm deliberately not filling the table from memory. Trailing/forward P/E and especially 14-day RSI move every single trading day."
That's the right call. It's also useless if you want an answer.
The model wasn't missing intelligence. It was missing data.
Feature 1: Connectors got 12 of 12 numbers right
A connector plugs Claude into an external tool through MCP (Model Context Protocol). The EODHD APIs MCP server exposes 72 read-only tools: prices, fundamentals, technicals, earnings calendars, news, macro data.
Setup is one URL. In Claude Desktop or claude.ai you add a custom connector with the OAuth endpoint:
https://mcp.eodhd.com/v2/mcp
In Claude Code (or any client that takes a key in the URL):
claude mcp add --transport http eodhd "https://mcp.eodhd.com/v1/mcp?apikey=YOUR_API_KEY"
Full instructions are on the EODHD MCP server page.
Same question, connector on. Claude made 23 tool round-trips in 72 seconds and returned this (data as of the 13 Nov 2026 close):
| Ticker | Trailing P/E | Forward P/E | RSI 14 |
|---|---|---|---|
| NVDA | 20.59 | 10.31 | 24.86 |
| PLTR | 118.30 | 69.44 | 39.46 |
| TSLA | 428.81 | 158.73 | 53.54 |
| NFLX | 17.96 | 16.58 | 38.43 |
Then I pulled the same figures myself from the REST API.
At first, the four RSI values didn't match. I was ready to write "Claude got RSI wrong."
It hadn't. I had.
My script requested RSI with only two and a half months of history. Wilder's RSI smooths over the whole series, so a short window drifts: my values were off by up to 0.55 points. With a year of history, all 12 numbers matched Claude's to the second decimal.
import os, requests

KEY = os.environ["EODHD_API_KEY"]

def rsi14(ticker):
    # a full year of warm-up: Wilder smoothing needs it
    r = requests.get(f"https://eodhd.com/api/technical/{ticker}.US",
                     params={"api_token": KEY, "fmt": "json",
                             "function": "rsi", "period": 14, "from": "2025-11-01"})
    return round(r.json()[-1]["rsi"], 2)

for t in ["NVDA", "PLTR", "TSLA", "NFLX"]:
    print(t, rsi14(t))
NVDA 24.86
PLTR 39.46
TSLA 53.54
NFLX 38.43
Where it broke: nowhere in the numbers. The cost is speed: 23 round-trips and 72 seconds for four tickers. And a free-form question gets a free-form answer, in a different shape every time. That's the next problem.
Best for: one-off questions you can't predict in advance.
Feature 2: A Skill made 5 of 5 answers come back in the same format
A Skill is a folder with a SKILL.md file: instructions Claude loads when the task matches. I turned my stock checklist into one.
---
name: stock-checklist
description: Run Kevin's 5-point stock checklist on one US ticker with live EODHD data.
---
Use only the EODHD MCP tools for numbers. Never estimate a figure from memory.

Score each line PASS / WATCH / FAIL:
- Valuation: forward P/E < 25 PASS, 25-40 WATCH, > 40 FAIL
- Quality: profit margin > 20% PASS, 10-20% WATCH, < 10% FAIL
- Growth: revenue growth YoY > 10% PASS, 0-10% WATCH, < 0 FAIL
- Trend: close above 200-day SMA PASS, else FAIL
- Momentum: RSI 14 between 40 and 70 PASS, 30-40 or 70-80 WATCH, otherwise FAIL

Output exactly this template and nothing else: [table + "Score: N/5 PASS" + one risk sentence]
Then I asked "Analyze [ticker]" for five tickers (NVDA, MSFT, TSLA, NFLX, AMD), once with the Skill installed and once without. Same connector, same model.
This is what the Skill returned for NVDA (data as of 13 Nov 2026):
| Check | Value | Result |
|---|---|---|
| Valuation (fwd P/E) | 10.3 | PASS |
| Quality (profit margin) | 63.7% | PASS |
| Growth (revenue YoY) | 105.9% | PASS |
| Trend (close vs SMA200) | 162.85 / 203.92 | FAIL |
| Momentum (RSI 14) | 24.9 | FAIL |
Score: 3/5 PASS.
Across the five runs:
| With the Skill | Without | |
|---|---|---|
| Same structure every time | 5 of 5 | 0 of 5 (6 to 8 different headings) |
| Length | 95 to 111 words | 533 to 816 words |
| Claude Code's cost estimate per run | about $1.02 | about $2.78 |
| Numbers matching my own EODHD pull | 24 of 25 exact, 1 off by 0.05% | not scored |
The one miss was MSFT's 200-day average: 440.70 against my 440.49.
Where it broke: the Skill only does what it's told. NVDA reports earnings on 17 November, the day after I ran this. The run without the Skill pulled the news and the calendar and flagged it. The Skill run didn't, because my checklist never asked for earnings dates. A rigid recipe is consistent, and blind to anything outside it.
Best for: the analysis you run the same way every week.
Feature 3: A scheduled task wrote my morning brief in 49 seconds
Scheduled tasks in the Claude desktop app run a prompt on a timer: every weekday at 8:00 (0 8 * * 1-5), for example. Each run starts fresh, so the prompt has to say everything.
Mine runs a short Python script that pulls the last two closes, RSI 14 and earnings dates in the next 14 days for the watchlist, then asks Claude to write a brief of 120 words at most, with "numbers only from the script output."
cal = get("calendar/earnings", symbols=",".join(f"{t}.US" for t in WATCHLIST),
          **{"from": today.isoformat(), "to": (today + dt.timedelta(days=14)).isoformat()})
earnings = {e["code"].split(".")[0]: e["report_date"] for e in cal.get("earnings", [])}

for t in WATCHLIST:
    eod = get(f"eod/{t}.US", **{"from": (today - dt.timedelta(days=10)).isoformat()})
    rsi = get(f"technical/{t}.US", function="rsi", period=14, **{"from": year_ago})[-1]["rsi"]
    last, prev = eod[-1], eod[-2]
    chg = (last["adjusted_close"] / prev["adjusted_close"] - 1) * 100
I triggered it once by hand on Monday 16 November. 49 seconds later, this was in the folder:
Data as of 2026-11-13 close (run on 2026-11-16)

Needs attention
- NVDA: 162.85, -2.01%, RSI 24.9 (RSI<30); earnings 2026-11-17
- AMD: 534.06, -8.75%, RSI 50.4 (MOVE>=3%)

Quiet
AAPL +0.39%, AMZN -0.29%, GOOGL -0.98%, META +2.90%, MSFT +0.17%,
NFLX -0.86%, PLTR -2.09%, TSLA -1.82%
Every number matched the script output. It caught the earnings date the Skill missed, because this time the data asked for it.
Where it broke: two real gotchas.
- Tasks run only while the desktop app is open. If the laptop is closed at 8:00, the brief arrives when you open it.
- I rotated my API key mid-test. The app keeps the environment it started with, so its connector kept sending the old key and got a 401. If a scheduled task suddenly fails after a key change, restart the app before debugging anything else.
I ran this once. I haven't left it running for weeks, so I can't tell you how it behaves on a bad data day.
Best for: anything you check at the same time every day.
Feature 4: An Artifact turned the data into a page I can share
Artifacts are pages Claude builds and publishes from the conversation. I asked it to turn the 10-stock dataset into a page I could share. It wrote a small Python generator from the saved EODHD data and published the result: a watchlist sorted by RSI, with P/E, margins, growth and a 30/70 band for each name.
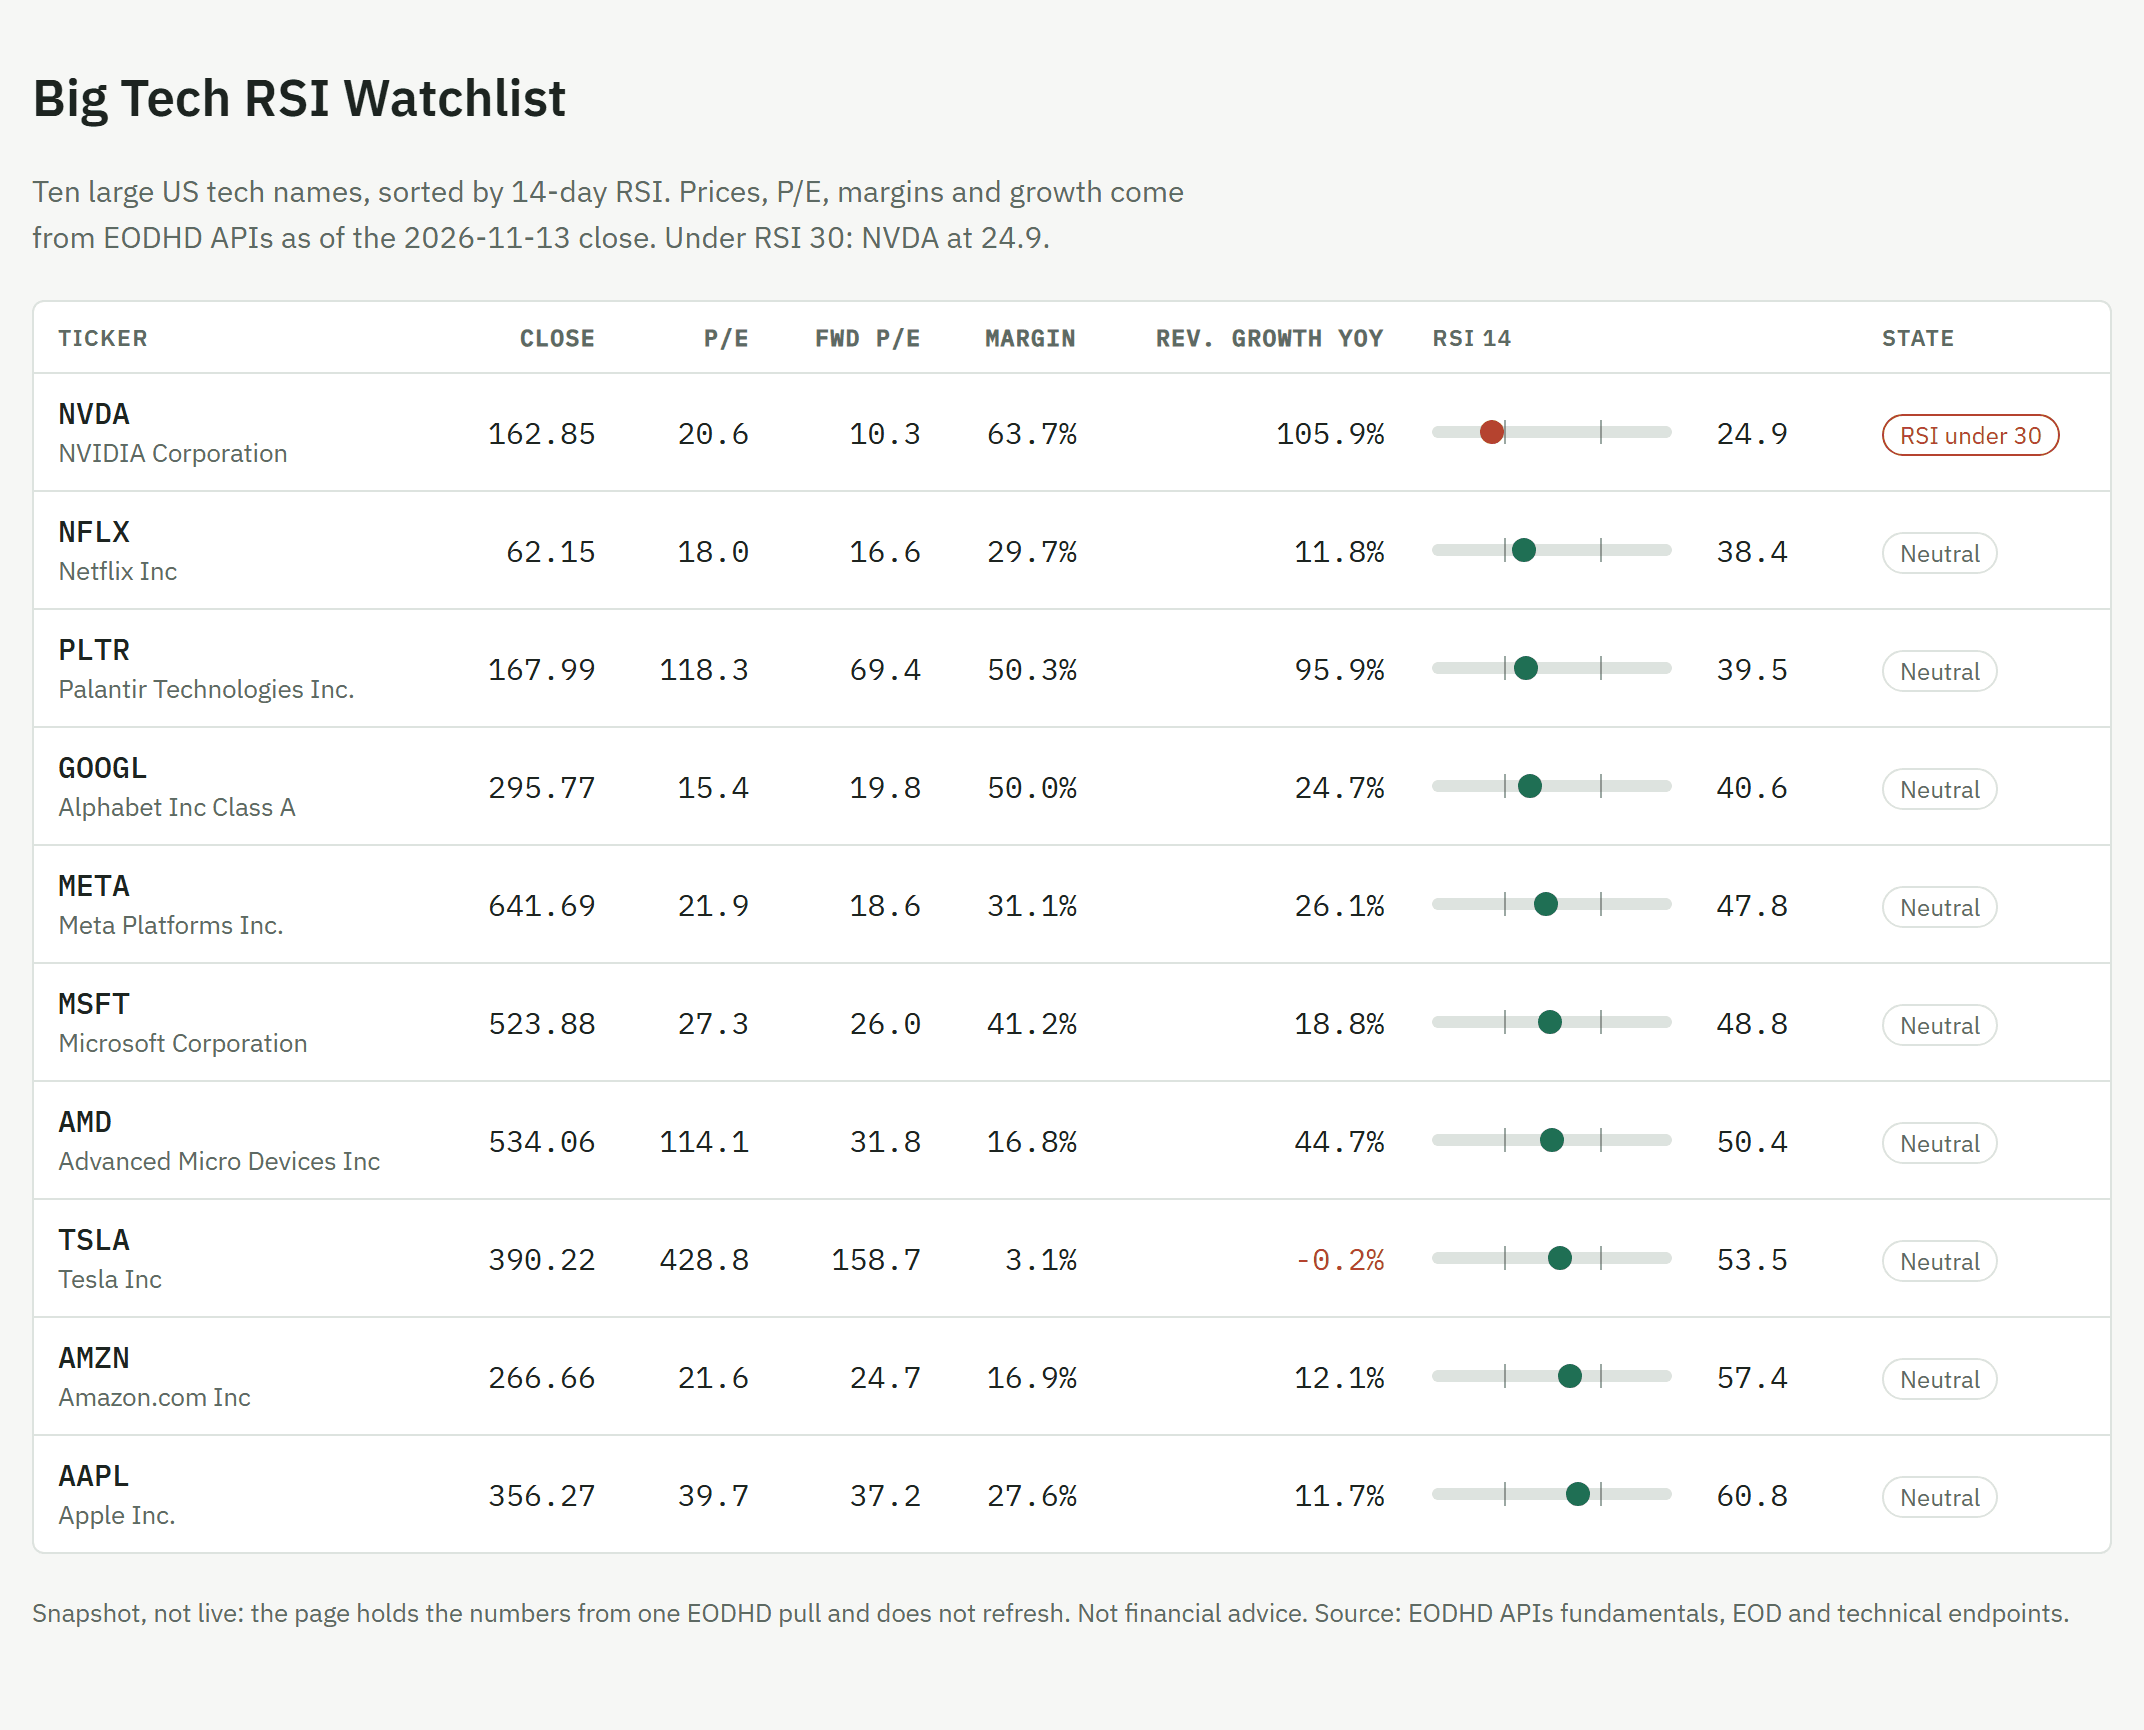
Ten rows, one glance, and the one name under 30 is the first thing you see.
Where it broke: it's a snapshot. The page holds the numbers from one pull and doesn't refresh. Making it live would mean putting an API key inside a page other people can open, which you shouldn't do. The first version I published also carried my wrong RSI values from Feature 1, and nothing flagged it. An Artifact makes your data look good. It doesn't check it. I fixed the data and republished to the same link.
Best for: sharing a result, not monitoring a market.
Feature 5: Claude Code wrote a backtest that matched mine on every strategy number
Chat is fine for reading numbers. It isn't where you want to run 10 years of daily prices through a strategy. Claude Code is: it writes files, runs them and reads the errors.
The prompt, in full:
Write and run a Python backtest. Data: EODHD APIs end-of-day endpoint, API key in the EODHD_API_KEY environment variable. Period 2016-01-04 to 2026-11-13. Strategy: hold SPY when the previous day's adjusted close is above its 200-day simple moving average, otherwise hold cash at 0%. Compare against buy-and-hold SPY. Report CAGR, max drawdown, number of trades and percent of days invested, ignoring costs. Never print the API key.
Seven turns and 71 seconds later it had a 150-line script, run without errors. It shifted the signal one day to avoid look-ahead and pulled extra history so the 200-day average existed on day one. I hadn't asked for either.
Then I wrote my own version from scratch and compared (adjusted prices as of 13 Nov 2026; they shift slightly after each SPY dividend):
| Claude Code | My check | |
|---|---|---|
| 200-day SMA strategy CAGR | 11.42% | 11.42% |
| Strategy max drawdown | -19.81% | -19.81% |
| Days invested | 83.5% | 83.5% |
| Trades | 53 (entries + exits) | 27 entries |
| Buy-and-hold CAGR | 14.62% | 14.77% |
| Buy-and-hold max drawdown | -33.72% | -33.72% |
The trend filter cut the worst drawdown from -33.7% to -19.8% and cost 3.2 to 3.4 points of CAGR a year. Less pain, less return. In a decade that mostly went up, sitting in cash on 16.5% of the days had a price.
Where it broke: the buy-and-hold CAGR. Claude's version effectively buys at the 31 December 2015 close, so it includes the 4 January return; mine buys on the 4 January close. Neither is wrong. But Claude made the choice without saying so, and a 0.15-point gap is exactly the kind of thing that turns into a wrong conclusion when two strategies are close. Read the code before you trust the table.
Best for: anything that needs years of data, a loop and a result you can re-run.
Which feature to set up first
| Feature | What I used it for | Time per run in my test | Main limit |
|---|---|---|---|
| Connector (MCP) | Ad-hoc questions with live numbers | 72 s for 4 tickers | Slow when the question repeats |
| Skill | My fixed checklist | 46 s to 3.3 min per ticker | Blind to what it doesn't ask for |
| Scheduled task | Morning brief | 49 s | Needs the app open |
| Artifact | A shareable watchlist page | not timed | Static snapshot |
| Claude Code | 10-year backtest | 71 s | Silent assumptions in the code |
The Skill runs ran in parallel with the no-Skill runs, so treat their timings as rough.
Start with the connector. The other four all depend on it: without data, every one of them is just a nicer way to say "I don't know."
What I'd actually trust from this
- The numbers, when the data comes through a tool. 12 of 12 in the first test, 24 of 25 exact in the Skill runs, every strategy metric in the backtest.
- Not the framing around them. The no-Skill runs wrote long, confident narratives around the same data. Useful context, but that's where opinion creeps in.
- Not the assumptions. Both mismatches in this test came from a choice, not a bad number: my RSI warm-up and Claude's backtest entry day.
Limits of this test: one watchlist of 10 US large caps, one trading day (data as of 13 Nov 2026), Claude Code 2.1.216 with Claude Opus 4.8, run on 16 Nov 2026. Five tickers per Skill condition is a small sample. The cost figures are Claude Code's own estimates, not an invoice.
Not financial advice. The checklist thresholds are mine, not a recommendation.
Where EODHD APIs fit
Every number in this article came from EODHD APIs: fundamentals, end-of-day prices, the RSI endpoint and the earnings calendar, through the MCP server or the REST API. One key works for both, so the connector, the script and the backtest all read the same data.
Two things to know before you copy this:
- The free plan won't reproduce it. It gives 20 calls a day and one year of end-of-day data, with no fundamentals. The All-In-One plan ($99.99 a month) covers every endpoint used here.
- The 200-day average and the RSI need history before your start date. Ask for at least a year more than you plan to use.
👉 Get started with EODHD APIs here, and use the code KEVIN10 at checkout for 10% off.
If you want more on the individual pieces: I covered connecting Claude to the EODHD MCP server step by step, a Python morning brief for your portfolio, and why most backtests lie.
FAQ
Can Claude analyze stocks with real-time data? Only through a tool. Without one, Claude refused to give P/E or RSI figures in my test. With the EODHD MCP server connected, it returned all 12 figures I asked for, matching the API.
What is the best Claude feature for stock analysis? The connector, because the other four depend on it. After that, a Skill for analysis you repeat and a scheduled task for analysis you repeat at a fixed time.
Can Claude Code backtest a trading strategy? Yes. In my test it wrote and ran a 10-year SPY backtest in 71 seconds, and every strategy metric matched an independent script. Check its assumptions; the buy-and-hold baseline used a different entry day than mine.
Do Claude scheduled tasks run when my computer is off? No. Scheduled tasks in the desktop app run while the app is open. A missed run starts the next time you open it.
The takeaway
Claude didn't get smarter between test one and test five.
It got data, a recipe, a timer, a page and a terminal. That's the whole difference.
I write technical content for SaaS and API companies: articles, tutorials and videos built on real tests like this one. If that's what your product needs, connect with me on LinkedIn or see my work at kevinmeneses.com.