I Gave Claude 30 Years of S&P 500 Data and Asked It If "Sell in May" Actually Works
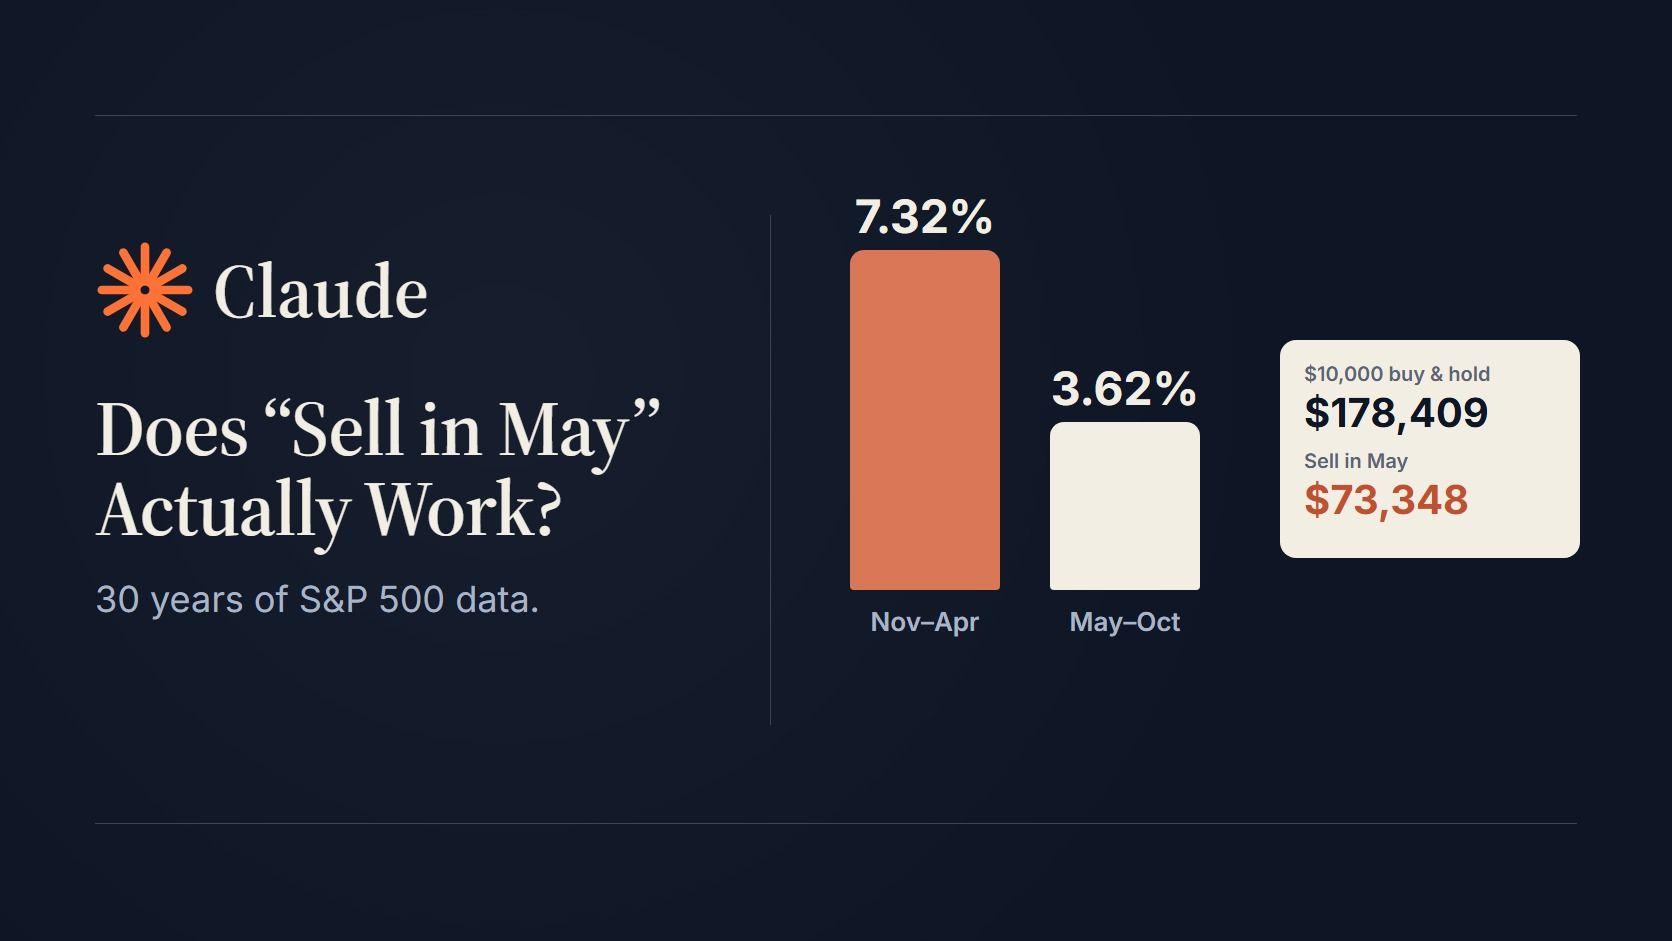
"Sell in May and go away" is older than most of the people who repeat it.
Almost nobody who repeats it shows the number.
So I pulled thirty years of daily S&P 500 data, cut each year into a November to April half and a May to October half, and compared them. 30 winters, 30 summers, dividends included, ending on October 30, 2026.
The rule turned out to be true and expensive at the same time.
If you're:
- holding an index fund and wondering whether to step aside every spring,
- building a backtest and tired of rules nobody has measured,
- or just curious what a market proverb looks like next to its own data,
keep reading.
The problem with market proverbs
Arguments about this rule tend to come in two kinds. One says the effect is real and shows a bar chart with a tall winter bar and a short summer bar. The other says it's a myth and shows last year's summer rally.
Both can be right. An average can favor winter while the strategy built on that average loses money.
What I wanted was the second number, the one the bar chart leaves out: if you had followed the rule every single year, where would you be?
The test
The setup, so you can check it:
- Data: daily prices for SPY, the S&P 500 ETF, from EODHD APIs. I used
adjusted_close, which includes dividends and splits, as the total-return series. - Cross-check: the S&P 500 index itself (
GSPC.INDX), price only, no dividends. - Window: October 31, 1996 to October 30, 2026. That's 30 full years.
- Winter runs from the last close of October to the last close of April. Summer is the other half.
- The Sell in May strategy holds SPY through winter and sits in cash at 0% through summer. No taxes, no trading costs.
- I ran it on November 12, 2026. Adjusted prices are as of November 11, 2026.
One note on that last line. Adjusted closes are recalculated after every dividend, and SPY pays one each quarter (the latest ex-dividend date in the data is September 18, 2026). Run this after the next one and the adjusted figures will shift slightly.
Here's the core of the script:
import os
import pandas as pd
import requests

KEY = os.environ["EODHD_API_KEY"]

def fetch(symbol):
    r = requests.get(
        f"https://eodhd.com/api/eod/{symbol}",
        params={"api_token": KEY, "fmt": "json",
                "from": "1990-01-01", "to": "2026-11-11"},
        timeout=60,
    )
    r.raise_for_status()
    df = pd.DataFrame(r.json())
    df["date"] = pd.to_datetime(df["date"])
    return df.set_index("date").sort_index()

def half_years(px, first_year, last_year):
    me = px.resample("ME").last()          # last close of each month
    rows = []
    for y in range(first_year, last_year + 1):
        oct_prev = me[pd.Timestamp(y - 1, 10, 31)]
        apr = me[pd.Timestamp(y, 4, 30)]
        oct_ = me[pd.Timestamp(y, 10, 31)]
        rows.append({"year": y,
                     "winter": apr / oct_prev - 1,
                     "summer": oct_ / apr - 1})
    return pd.DataFrame(rows).set_index("year")

spy = fetch("SPY.US")
h = half_years(spy["adjusted_close"], 1997, 2026)

print(h.mean().mul(100).round(2))
print("winter beat summer:", (h["winter"] > h["summer"]).sum(), "of", len(h))
print("buy & hold:  ", round(10000 * ((1 + h["winter"]) * (1 + h["summer"])).prod()))
print("sell in May: ", round(10000 * (1 + h["winter"]).prod()))
Output:
winter    7.32
summer    3.62
dtype: float64
winter beat summer: 22 of 30
buy & hold:   178409
sell in May:  73348
One call returned 8,505 daily bars for SPY going back to January 1993. The rest is pandas.
What the numbers actually said
SPY with dividends, 1997 to 2026, adjusted prices as of November 11, 2026:
| Winter (Nov to Apr) | Summer (May to Oct) | |
|---|---|---|
| Average return | 7.32% | 3.62% |
| Median return | 7.31% | 4.11% |
| Positive half-years | 24 of 30 | 23 of 30 |
| Worst | -10.89% (2001) | -29.21% (2008) |
Winter beat summer in 22 of the 30 years.
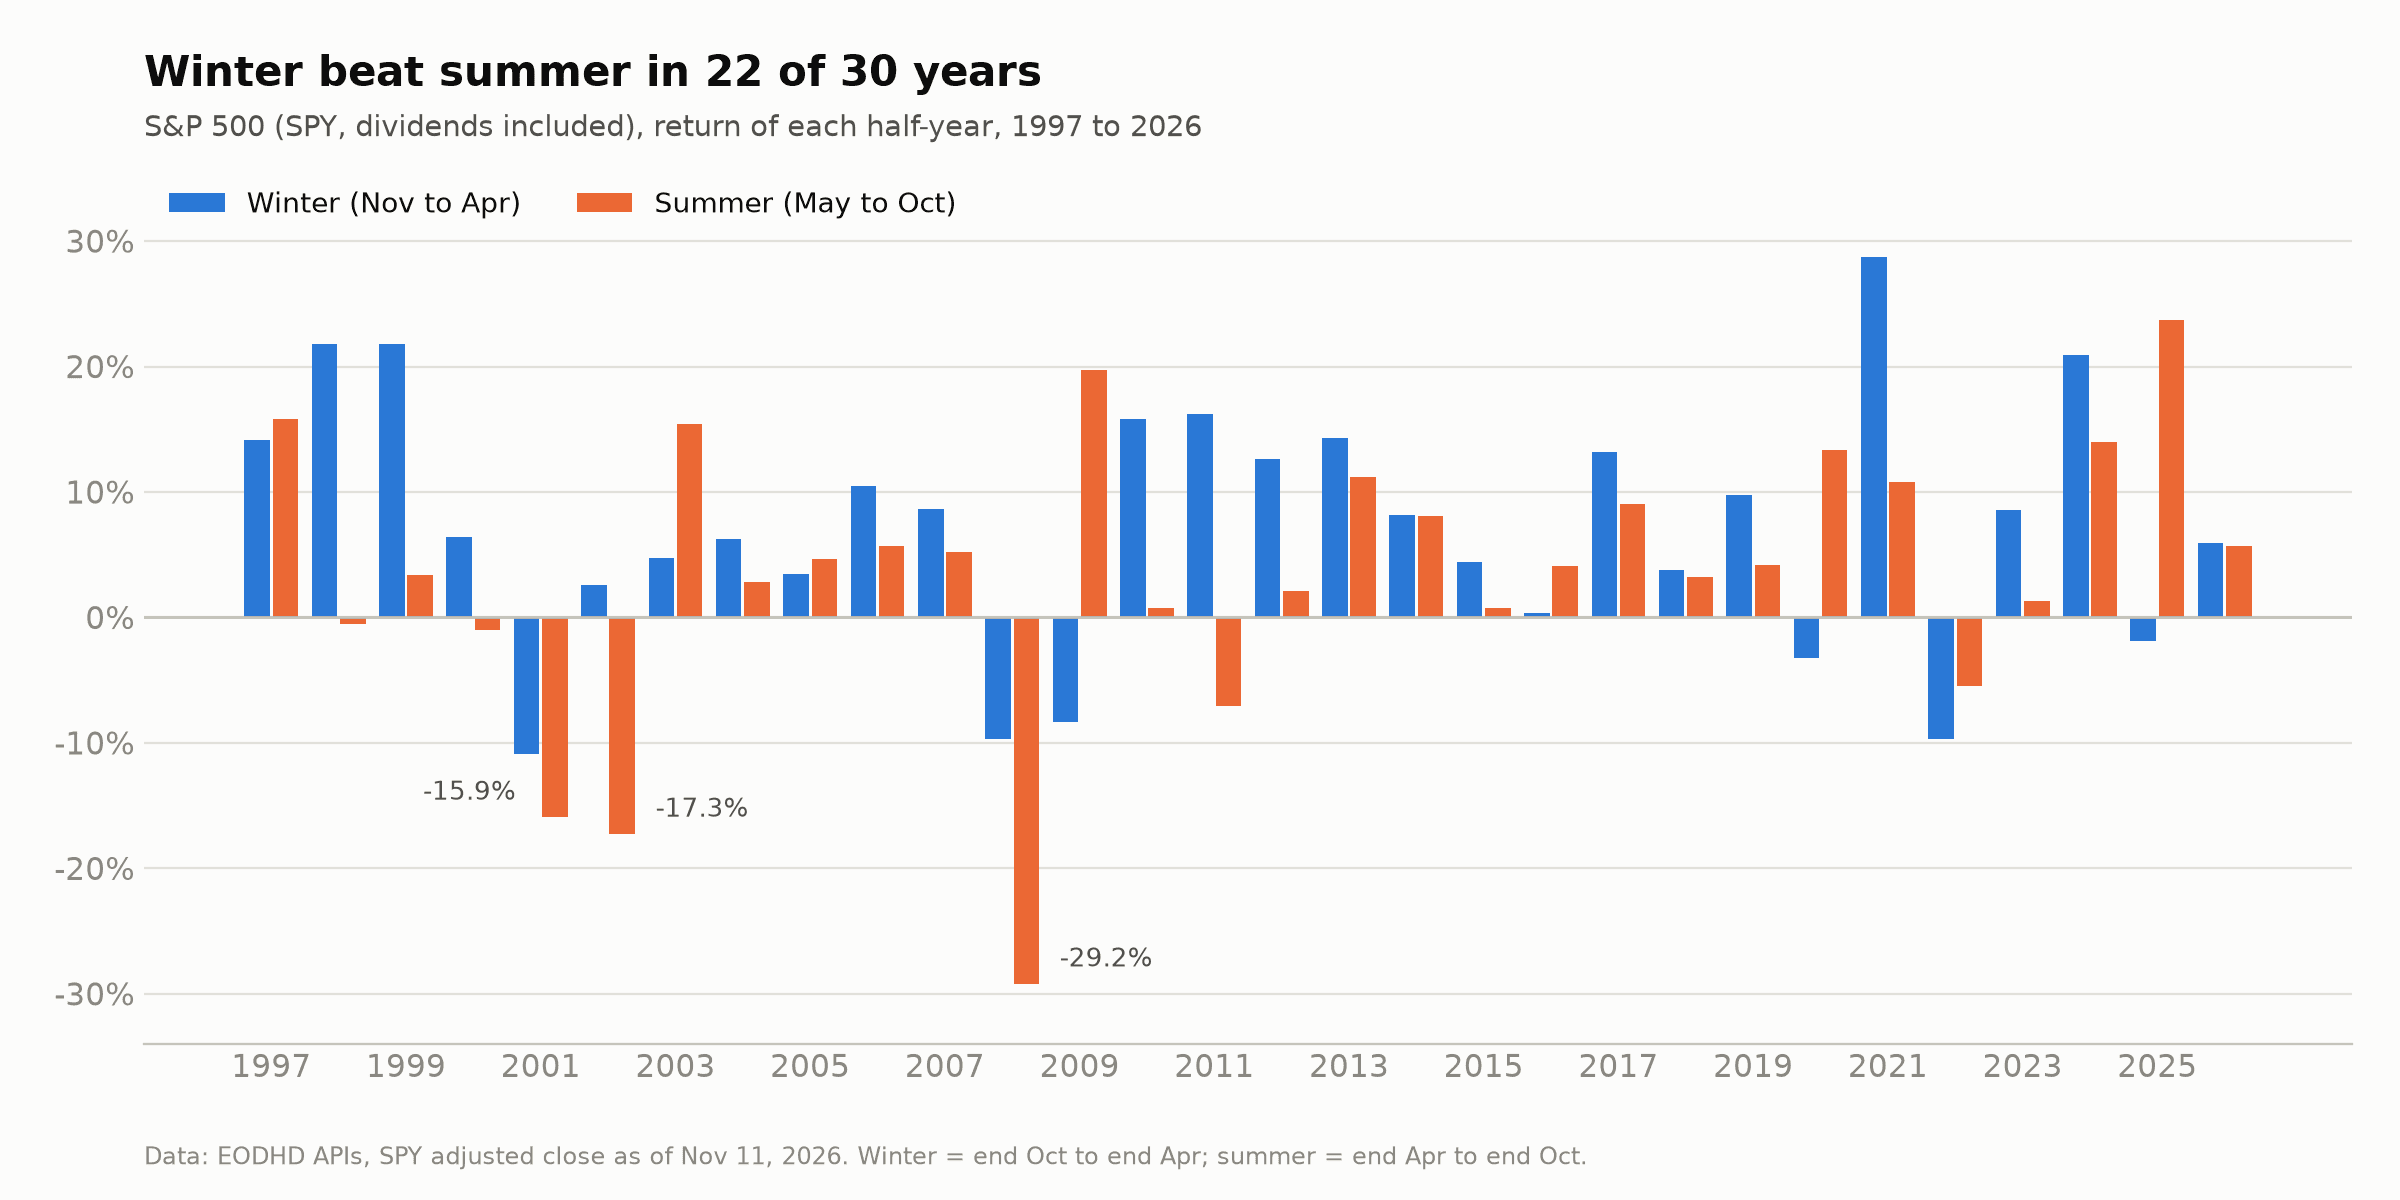
I went in expecting the proverb to fall apart. It didn't. Over three decades, the November to April half earned about twice what the May to October half did.
Now the part the bar chart leaves out.
Summer was still positive in 23 of 30 years, and its average was 3.62%. Most years, selling in May means giving up a gain.
What following the rule would have cost
$10,000 invested on October 31, 1996:
| Strategy | Value on Oct 30, 2026 | Annualized |
|---|---|---|
| Buy and hold SPY | $178,409 | 10.08% |
| Sell in May (cash at 0% in summer) | $73,348 | 6.87% |
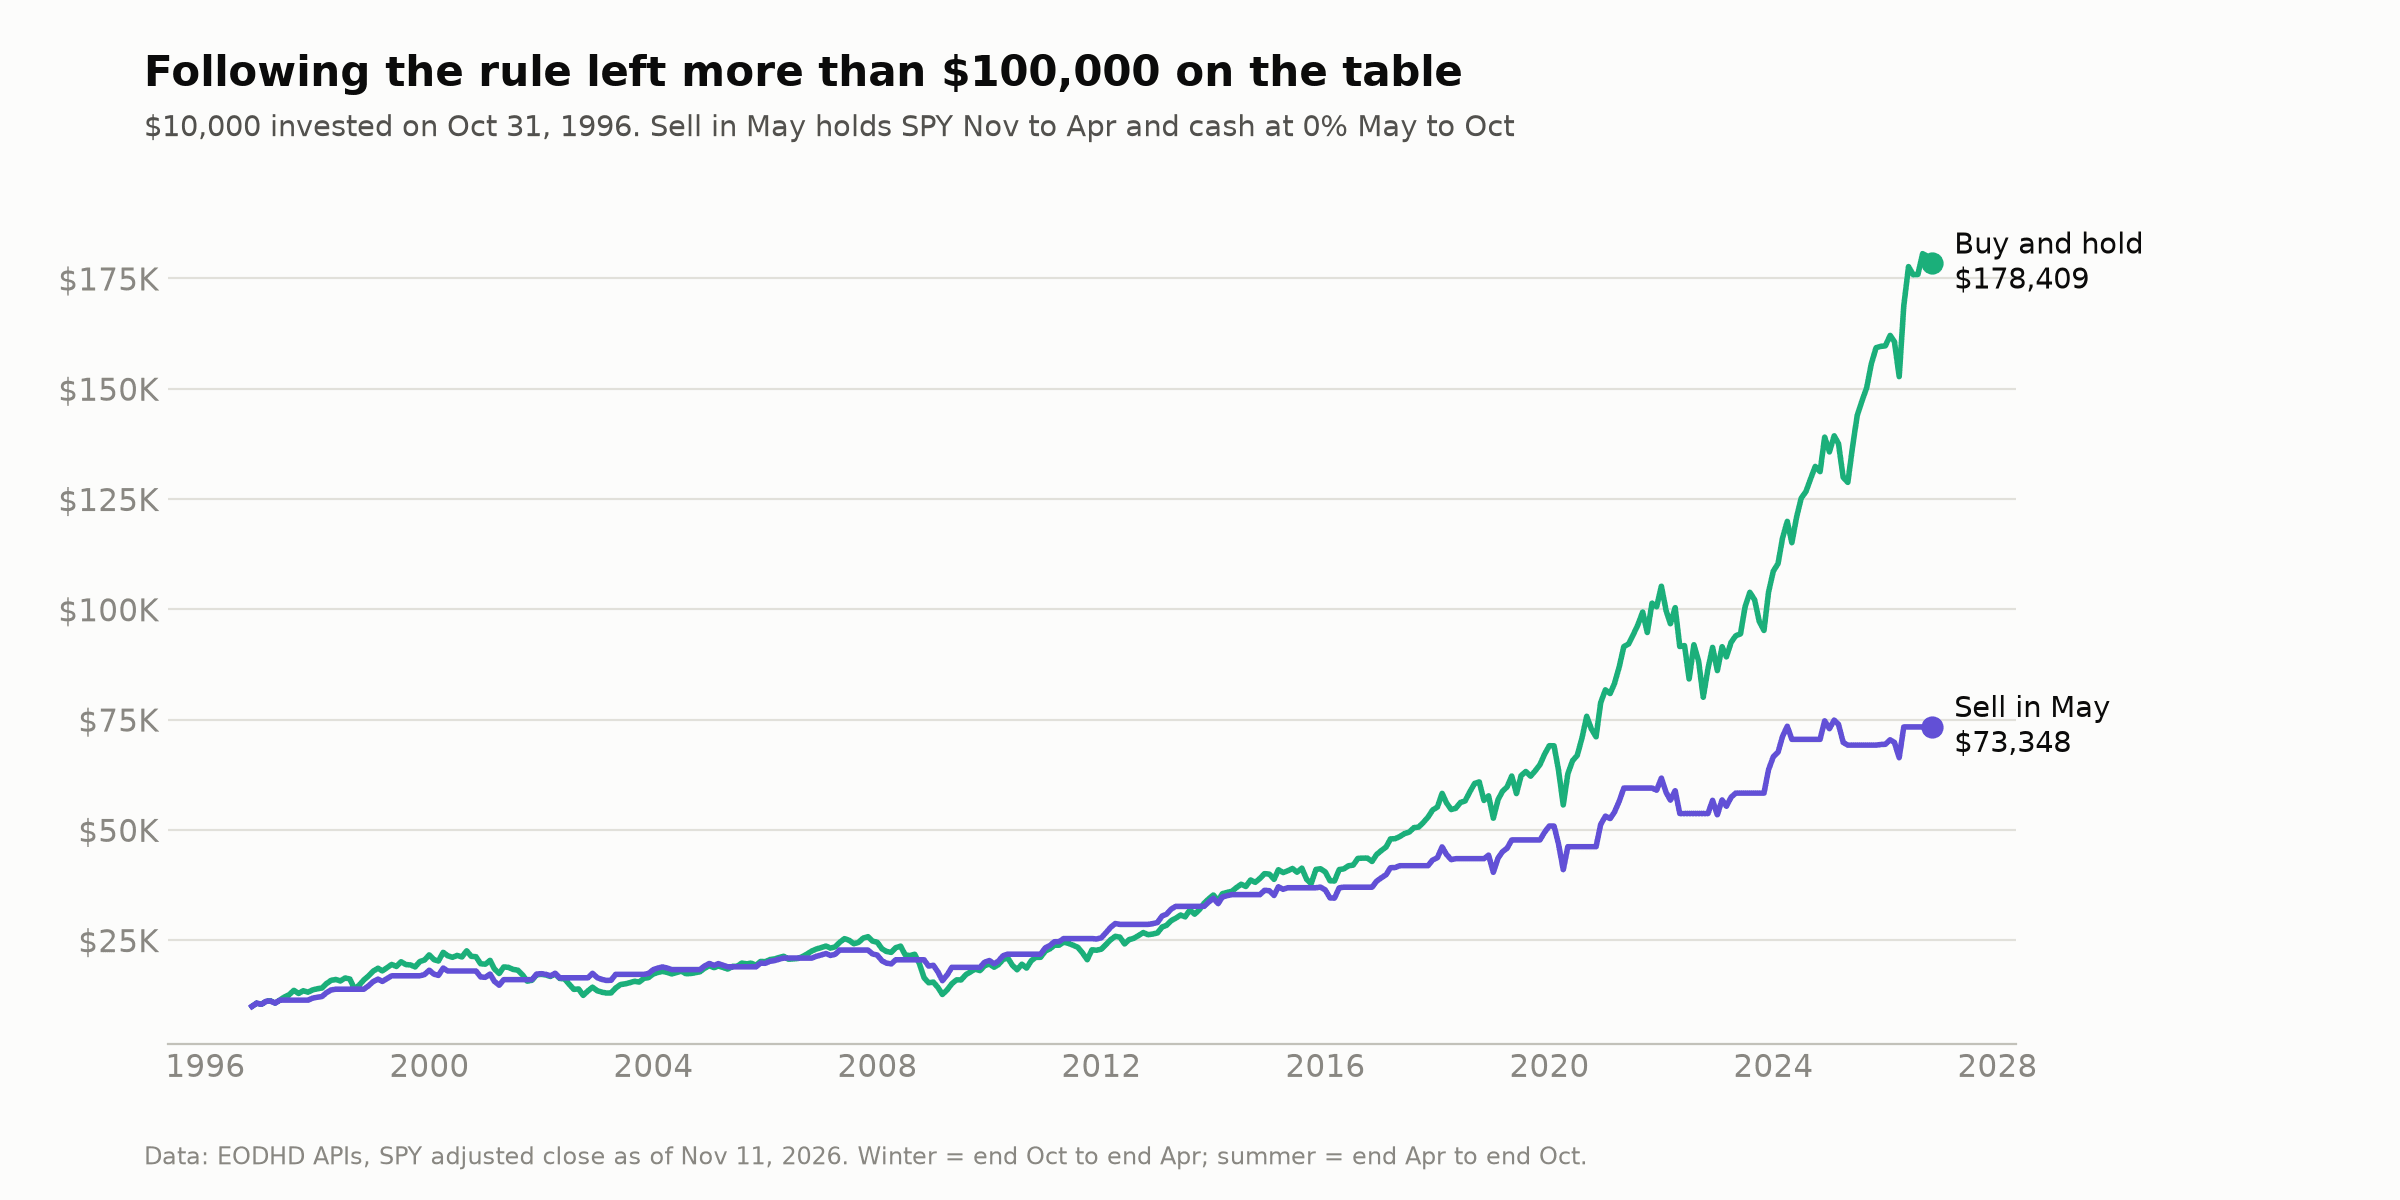
The weaker half of the year is still worth more than $100,000 of the final balance.
That's the gap between "summer is weaker" and "summer is bad". The first is what the data shows. The second is what the rule assumes.
Three summers explain a third of the gap
I ranked the 30 summers from worst to best. The bottom three:
- 2008: -29.21%
- 2002: -17.27%
- 2001: -15.92%
Take those three years out and the summer average rises from 3.62% to 6.33%, against 8.80% for winter in the same 27 years. The gap shrinks from 3.70 points to 2.47.
So about a third of the difference comes from three years out of thirty. The other two thirds are spread across the remaining 27, which is more than I expected.
Splitting the sample by decade tells the same story from another angle:
| Decade | Winter avg | Summer avg | Winter beat summer | $10,000 buy and hold | $10,000 sell in May |
|---|---|---|---|---|---|
| 1997 to 2006 | 8.08% | 1.31% | 7 of 10 | $22,567 | $20,950 |
| 2007 to 2016 | 6.26% | 1.57% | 8 of 10 | $18,989 | $17,669 |
| 2017 to 2026 | 7.62% | 7.98% | 7 of 10 | $41,634 | $19,815 |
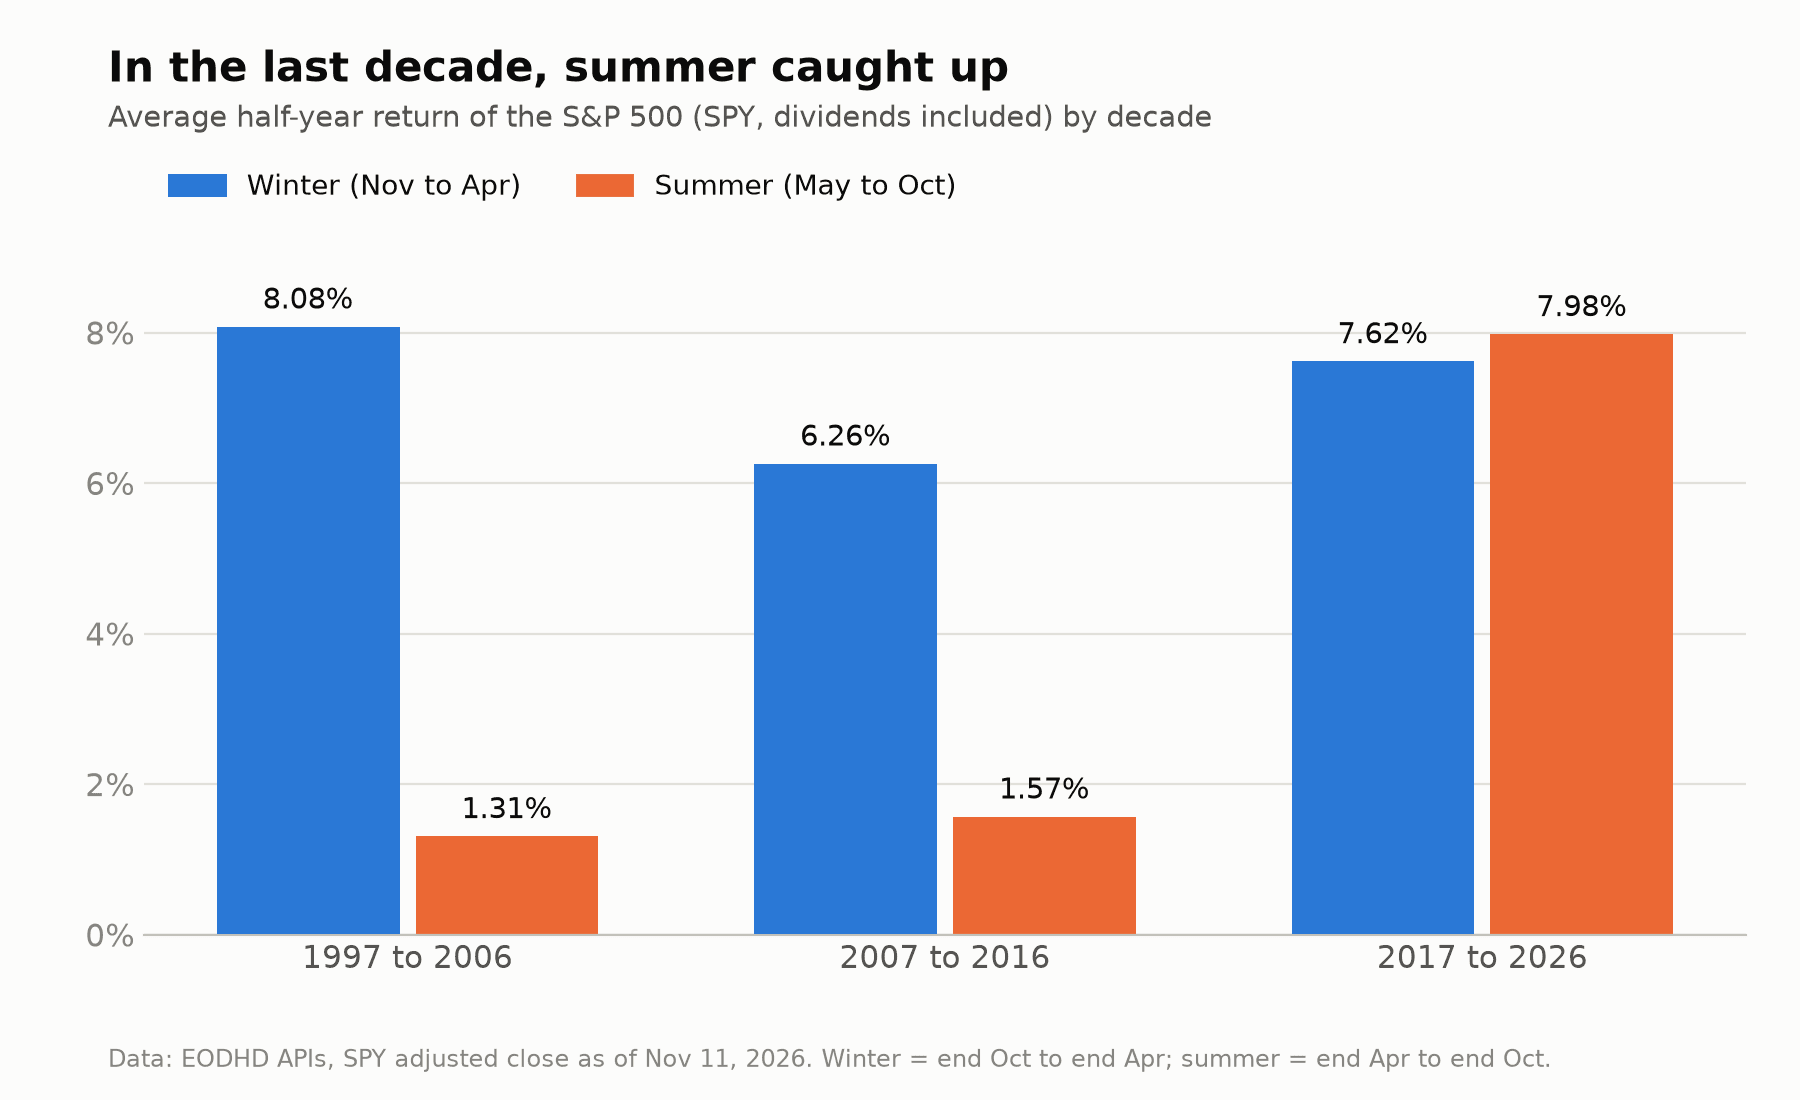
In the first two decades, the rule almost kept up with buy and hold while being invested half the time. Both of those decades include a summer that fell more than 17%.
In the last ten years the summer average was slightly higher than the winter one. Winter still won 7 of the 10 individual years, but that decade had summers like 2025 (+23.70%) and 2020 (+13.36%) and no summer worse than -5.47%. Someone who followed the rule from 2017 ended with less than half of what buy and hold produced.
Thirty years sounds like a lot of data. For this question it's 30 observations, and whether the rule looks good depends heavily on which ten you pick.
Dividends don't rescue it or break it
I expected dividends to matter, since the cash strategy gives up six months of them every year. So I reran the test on the S&P 500 index itself, price only:
| Series | Winter avg | Summer avg | Gap |
|---|---|---|---|
| SPY with dividends | 7.32% | 3.62% | 3.70 points |
| S&P 500 index, price only | 6.38% | 2.79% | 3.59 points |
The gap is nearly identical. Dividends raise both halves by about the same amount, so the seasonal pattern is there with or without them. I was wrong about that one.
Where EODHD fits into this workflow
The whole test ran on one endpoint. The end-of-day API from EODHD APIs returned raw and adjusted closes for SPY back to 1993 and for the index over the same window, with splits and dividends already handled, so I didn't have to rebuild a total-return series myself.
One thing to know before you try it: the free plan returns one year of end-of-day history. Thirty years needs the EOD Historical All-World plan, which is $19.99 a month.
The same setup extends without much extra work:
- run the split on other indices or single stocks (the ticker is one string),
- test other calendar rules, like the January effect or turn-of-the-month,
- swap the cash leg for whatever you'd actually hold in summer.
If you want to run this on your own tickers, get an EODHD API key here and use the code KEVIN10 at checkout for 10% off.
Reproducing this without writing a script
EODHD APIs also ships an MCP server, so Claude can call the same endpoint from a conversation. Once the connector is added in Claude, this prompt describes the test above:
Pull monthly adjusted close data for SPY.US from EODHD, from October 1996 to October 2026. For each year from 1997 to 2026, calculate the return from the last close of October of the previous year to the last close of April (winter), and from the last close of April to the last close of October (summer). Report the average and median of each half, how many years winter beat summer, and the final value of $10,000 for buy and hold versus holding only in winter with cash at 0% in summer. Then repeat the averages by decade and show the three worst summers.
For a one-off question the connector is faster. For something you'll rerun every year, keep the script.
What I'd actually trust from this
The seasonal gap is real in this sample. Winter averaged 7.32% and summer 3.62%, and winter won 22 of 30 years. I can't call that a myth.
The trading rule built on it lost. $73,348 against $178,409. A weaker half-year that is still positive most of the time is not something you want to skip.
The result depends on the window. 2001, 2002 and 2008 account for about a third of the gap, and in the most recent decade the summer average was the higher one.
What would change this. The test assumes summer cash earns nothing, no taxes and no costs. I didn't test the alternatives here. In principle, cash that pays interest would narrow the difference and taxes on selling every May would widen it again, but those are assumptions until someone measures them.
None of this is investment advice. It's one index, one country and 30 observations, measured as honestly as I could.
FAQs
Does "sell in May and go away" work? In this 30-year S&P 500 sample, the November to April half returned more on average (7.32% vs 3.62%), but selling every May and sitting in cash ended with $73,348 against $178,409 for buy and hold.
What is the average S&P 500 return from May to October? 3.62% with dividends over 1997 to 2026, measured on SPY's adjusted close as of November 11, 2026. It was positive in 23 of 30 years.
Which were the worst summers? 2008 (-29.21%), 2002 (-17.27%) and 2001 (-15.92%).
Has the effect weakened? In the last decade of this sample, yes on averages: from 2017 to 2026 summer averaged 7.98% and winter 7.62%, although winter still won 7 of those 10 years. One decade is not enough to call it a trend.
Can I run this on another index or stock? Yes. Change the ticker in the script or in the prompt. The method only needs daily or monthly adjusted closes.
Ready to test a market rule yourself? Start with EODHD APIs here and use the code KEVIN10 at checkout for 10% off.
Related: I Gave Claude 10 Years of Market Data and Asked It What Actually Predicts Returns and Backtesting in Python: Why Most Backtests Lie.
More breakdowns like this one at kevinmeneses.com.