For three years, I thought my portfolio was returning around 14% a year. It wasn’t. I had never actually measured it — I had just read a number my broker put on screen and believed it.
Most investors never question that number.
It’s right there on the dashboard. Green if you’re up, red if you’re down. It looks like performance. It feels like performance.
It isn’t.
If you’re:
adding capital to your portfolio at irregular intervals,
holding positions across more than one broker,
or trying to figure out if you’re actually beating the market,
this matters more than you think.
The Number Your Broker Shows You Isn’t Your Return
Open any broker app and you’ll find a gain/loss figure. Something like “+18.4% since you opened this position.”
That number answers one question: how has the price moved since you bought.
It does not answer the question you actually care about: how well is my money working, given when I put it in and how much I added over time.
Those are two completely different calculations.
If you invested €10,000 in January and added another €5,000 in October, right before a rally, your broker’s simple return blends both amounts together as if they’d been invested for the same length of time. They weren’t. The October money barely had time to do anything, but it gets credited with the same performance as the January money.
The result: a return percentage that flatters you or punishes you, almost at random, depending on when you happened to add cash.
The Real Problem: How You’re Measuring Your Investments
This is the part most investors never get to, because their broker never shows them the alternative.
There are two metrics built specifically to solve this: Time-Weighted Return (TWR) and Internal Rate of Return (IRR).
TWR strips out the effect of when you added or withdrew money. It measures the pure performance of the strategy itself — useful for comparing your results against a benchmark like the S&P 500, regardless of your personal cash flow timing.
IRR does the opposite on purpose: it accounts for exactly when your money went in and came out, giving you the true annualized return on your actual capital. It’s the number that tells you whether you, personally, made a good decision — not just whether the market went up.
Neither of these appears on a standard broker dashboard.
You’re navigating one of the most important decisions of your financial life — whether your strategy is working — using a metric that wasn’t designed to answer that question.
Related articles
What Proper Performance Analysis Actually Looks Like
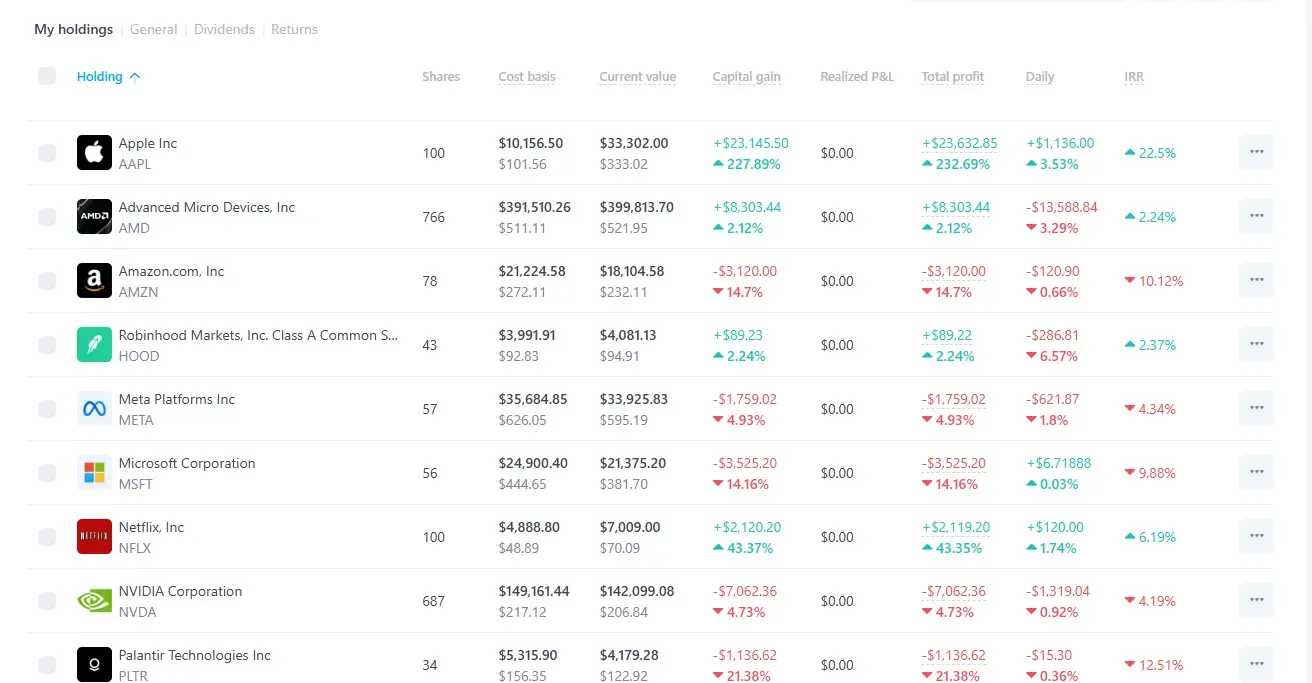
I moved my performance tracking into Snowball Analytics, a portfolio visualizer built for exactly this problem — I wanted to know my real number, not the one my broker was comfortable showing me.
Instead of a single gain/loss figure, Snowball breaks performance down into the metrics that actually matter:
Time-weighted return, so you can compare your strategy against a benchmark fairly
IRR (money-weighted return), so you know the true annualized return on your actual invested capital
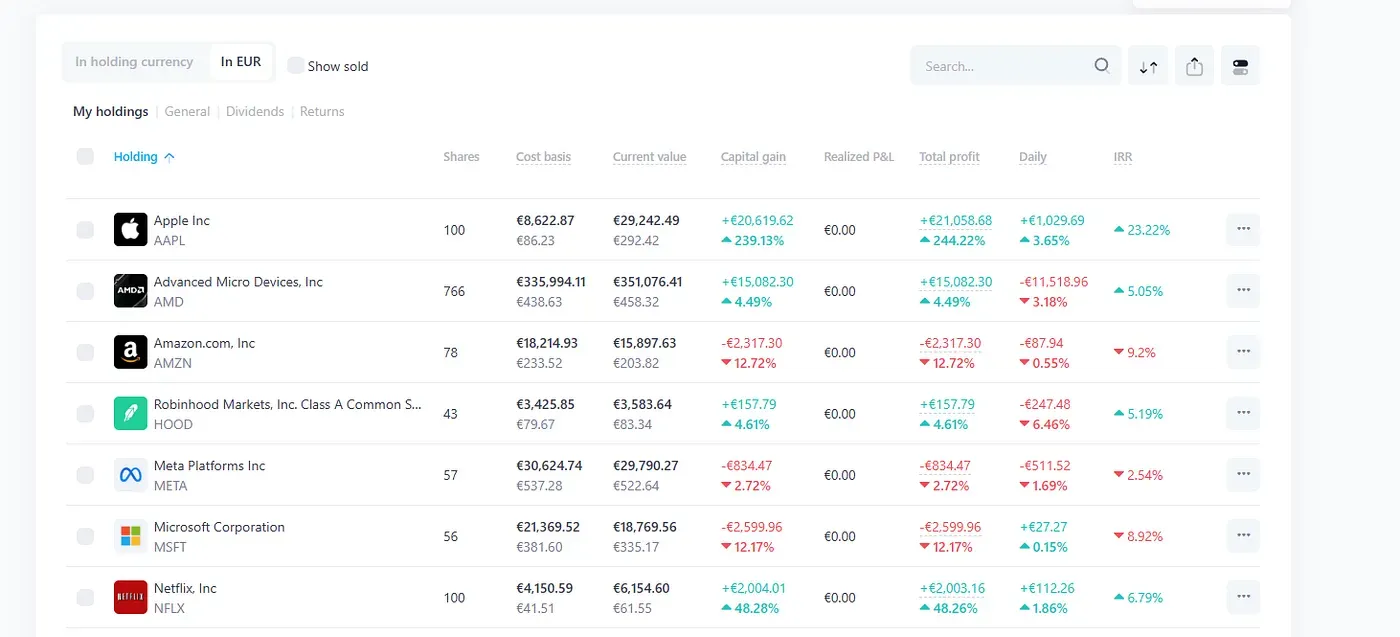
Performance in your base currency, adjusted for exchange rate movement across accounts
Benchmark comparison, so “did I beat the market” has an actual answer instead of a guess
The first time I looked at this view, the gap between what I thought I’d earned and what I’d actually earned was uncomfortable. Not catastrophic — just enough to show me I’d been making decisions based on a number that was quietly wrong the whole time.
Stop Guessing Your Real Returns
See your true portfolio performance — time-weighted, IRR, and benchmark-adjusted — across every broker you use, in one view. →Start your free trial with Snowball Analytics
A Concrete Example: Beating the Market vs. Feeling Like You Are
Say you’ve been adding €500 a month to a mix of individual stocks and a couple of ETFs since 2023. Your broker shows total gains of +22% since inception.
Sounds solid. But that number tells you nothing about whether you outperformed simply buying VOO every month with the same €500.
Run it through TWR and benchmark comparison, and you might find your actual annualized performance is 9.8% — while a plain S&P 500 DCA strategy over the same period returned 11.2%.
You weren’t beating the market. You were underperforming it, while feeling like you were winning, because the only number in front of you was a vague total gain figure with no reference point.
That’s the entire value of proper performance analysis: it replaces a feeling with a fact.
A Second Example: The Currency Trap
Here’s one most investors never even think to check.
Say you’re based in Spain, investing in euros, but half your portfolio sits in US-listed stocks and ETFs priced in dollars. Your broker shows each position’s return in its own listing currency — often without adjusting for how EUR/USD has moved since you bought.
If the dollar weakened 6% against the euro over the period you held a position, a stock that gained 15% in USD terms actually returned closer to 9% once converted back to your base currency. Your broker’s screen still proudly shows +15%.
Multiply that across a dozen positions bought at different times, in different currencies, and the gap between “what the screen says” and “what you actually made in euros” becomes real money — not a rounding error.
This is exactly the kind of distortion that TWR and IRR calculations need to account for — and exactly the kind of detail a simple gain/loss percentage was never built to handle.
Common Mistakes Investors Make When Analyzing Performance
1. Comparing your total return to “the market” without a matching timeline.
Saying “I’m up 20%, the S&P 500 is up 15%, so I’m winning” only works if both numbers cover the exact same period and the exact same contribution schedule. Most investors compare mismatched timeframes without realizing it.
2. Averaging returns across positions instead of weighting by capital.
A position that’s up 80% on a €200 investment does not offset a position down 10% on €8,000 — but a simple average of the two percentages makes it look like it does.
3. Ignoring currency conversion entirely.
As above. If any part of your portfolio is priced in a currency different from your own, your real return depends on the exchange rate, not just the local price movement.
4. Treating dividends as separate from total return.
Some investors track price appreciation and dividend income as two unrelated numbers, then quote only the price gain when talking about “performance.” Total return includes both — leaving out dividends understates how a stock actually performed for you.
5. Recalculating everything manually in a spreadsheet that goes stale.
TWR and IRR are not simple percentage formulas — they require tracking every cash flow event with its exact date. One missed entry and the whole calculation is wrong, silently.
Practical Tips to Get This Right
Always check which return metric you’re looking at before drawing a conclusion. A screen that just says “Return: +12%” without specifying TWR, IRR, or simple gain/loss is not enough information to act on.
Set your base currency once, and force every position into it. Don’t try to mentally convert USD, GBP, or CHF positions in your head — let the tool do it consistently, position by position.
Review benchmark comparison quarterly, not daily. Checking whether you’re beating the S&P 500 every day just adds noise. A quarterly review over a meaningful timeframe tells you whether your strategy actually works.
When you add a lump sum, note the date. If you’re tracking IRR manually or want to sanity-check a tool’s output, the exact date of every deposit matters as much as the amount.
Don’t judge a single position’s IRR in isolation during year one. IRR is sensitive to short time horizons — a position held eight months can show a wildly exaggerated annualized number in either direction. Give it time before drawing conclusions.
Three Things to Take Away
Your broker’s gain/loss number is not your return. It ignores timing entirely.
TWR and IRR answer different questions — one about your strategy, one about your actual decisions. You need both.
A return without a benchmark isn’t information. “+18%” means nothing until you know what the alternative would have earned.
FAQs
❓ What’s the difference between TWR and IRR?
✅ TWR removes the effect of when you added or withdrew cash, isolating pure strategy performance — ideal for comparing against a benchmark. IRR accounts for your actual cash flow timing, giving you the true annualized return on your specific capital. Serious performance analysis needs both.
❓ Why doesn’t my broker show me time-weighted return?
✅ Most broker apps are built around executing trades, not analyzing long-term performance. A simple gain/loss figure is easy to display and doesn’t require tracking cash flow timing the way TWR and IRR calculations do.
❓ How do I compare my portfolio against the S&P 500 fairly?
✅ You need a benchmark comparison that accounts for your own contribution schedule — not just “the index went up X%.” Tools like Snowball Analytics calculate this automatically across all your connected accounts.
The goal was never to earn a bigger number.
It was to finally know the real one.
Need Content Like This for Your Fintech or Investing Product?
I write technical, non-fluff articles that developers and investors actually want to read. →See my work